
Figure 1.
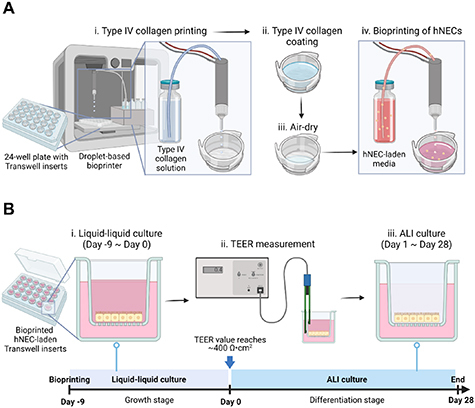
A schematic image illustrating (A) DBB of the nasal tissue model and (B) its culture along with the timeline for liquid–liquid followed by ALI culture. This figure was created using BioRender (https://biorender.com).
Official websites use .gov
A
.gov website belongs to an official
government organization in the United States.
Secure .gov websites use HTTPS
A lock (
) or https:// means you've safely
connected to the .gov website. Share sensitive
information only on official, secure websites.
A schematic image illustrating (A) DBB of the nasal tissue model and (B) its culture along with the timeline for liquid–liquid followed by ALI culture. This figure was created using BioRender (https://biorender.com).