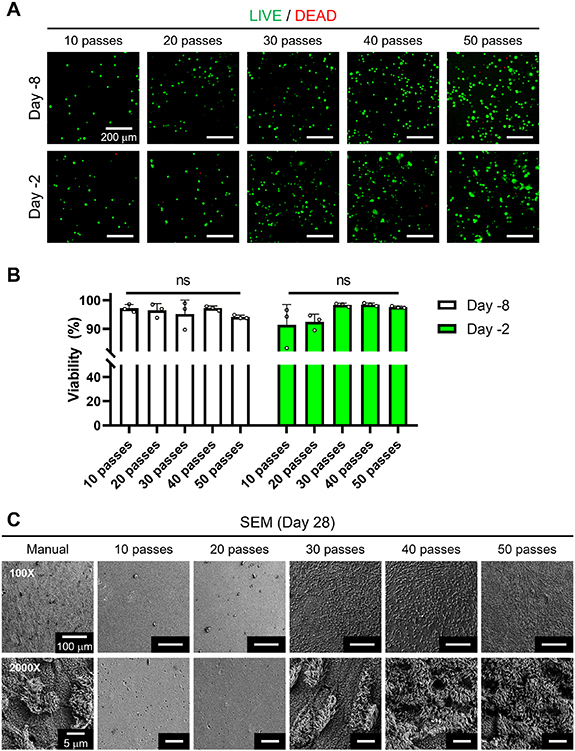
Figure 2.

Cell viability measurements using the LIVE/DEAD assay. (A) Representative fluorescent images of hNECs at different densities at Day −8 and Day −2, and (B) cell viability (%) for all bioprinted groups including 10-, 20-, 30-, 40- and 50-pass groups (n = 3; ns denotes ‘not significant’). (C) SEM images of hNECs at Day 28 of ALI culture.
