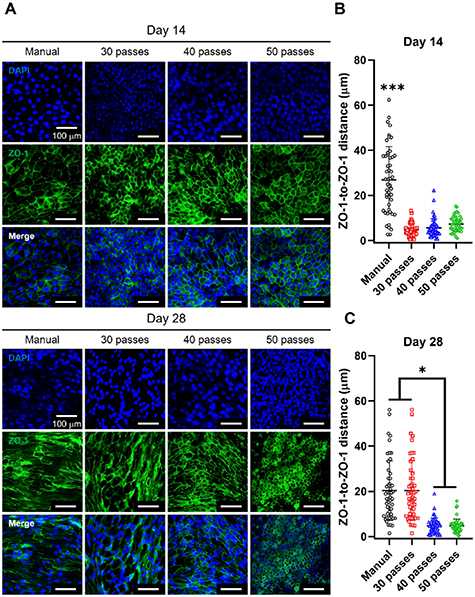
Figure 3.

Evaluation of tight junctions in nasal epithelium using ZO-1 staining. (A) Confocal images of ZO-1 staining of hNECs in ALI culture of manual (control) and bioprinted (30-, 40- and 50-pass) groups at Weeks 2 and 4. Characterization of ZO-1 staining with respect to ZO-1-to-ZO-1 distance at Week (B) 2 and (C) 4 (n = 3; p * < 0.05 and p *** < 0.001).
