
Figure 5.
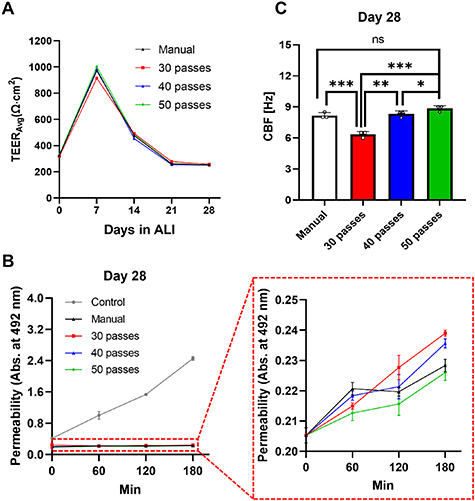
Functional analysis of nasal epithelial tissues, including manual and bioprinted (30-, 40- and 50-pass) groups. (A) Measurement of TEER values during the 28 d differentiation. (B) Comparison of Dextran permeability and (C) CBF at Day 28 (n = 3; p * < 0.05, p ** < 0.01 and p *** < 0.001; ns denotes ‘not significant’).