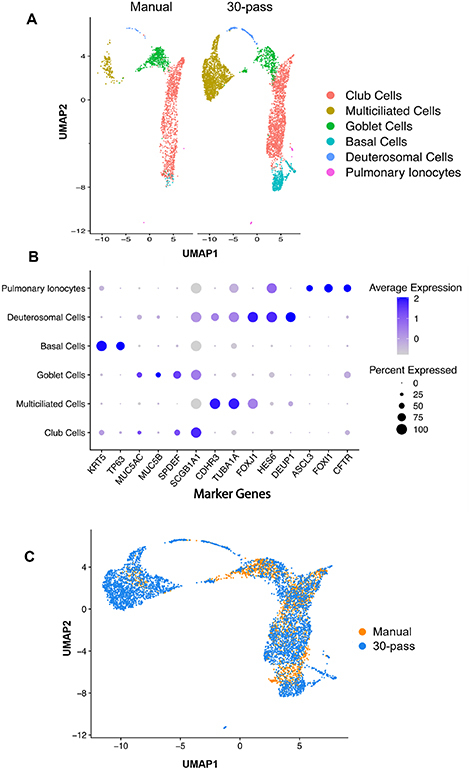
Figure 7.

Defining bioprinted nasal cell populations using scRNA-seq. (A) UMAP plot visualization of single cells isolated from manually seeded (1829 cells) and bioprinted (4679 cells) nasal epithelial inserts that passed quality control metrics using Seurat. Putative cellular communities are presented on the right indicated in the legend. (B) Dotplot heatmap of average scaled gene expression of known nasal epithelial marker genes split by cell cluster using Seurat for merged data of manual seeded and bioprinted inserts. Size of the dot indicates percent of cells expressing that gene and the shade of purple represents the average gene expression. (C) UMAP overlay of manually seeded (orange) and bioprinted (blue) samples to show similarity of cell populations.
