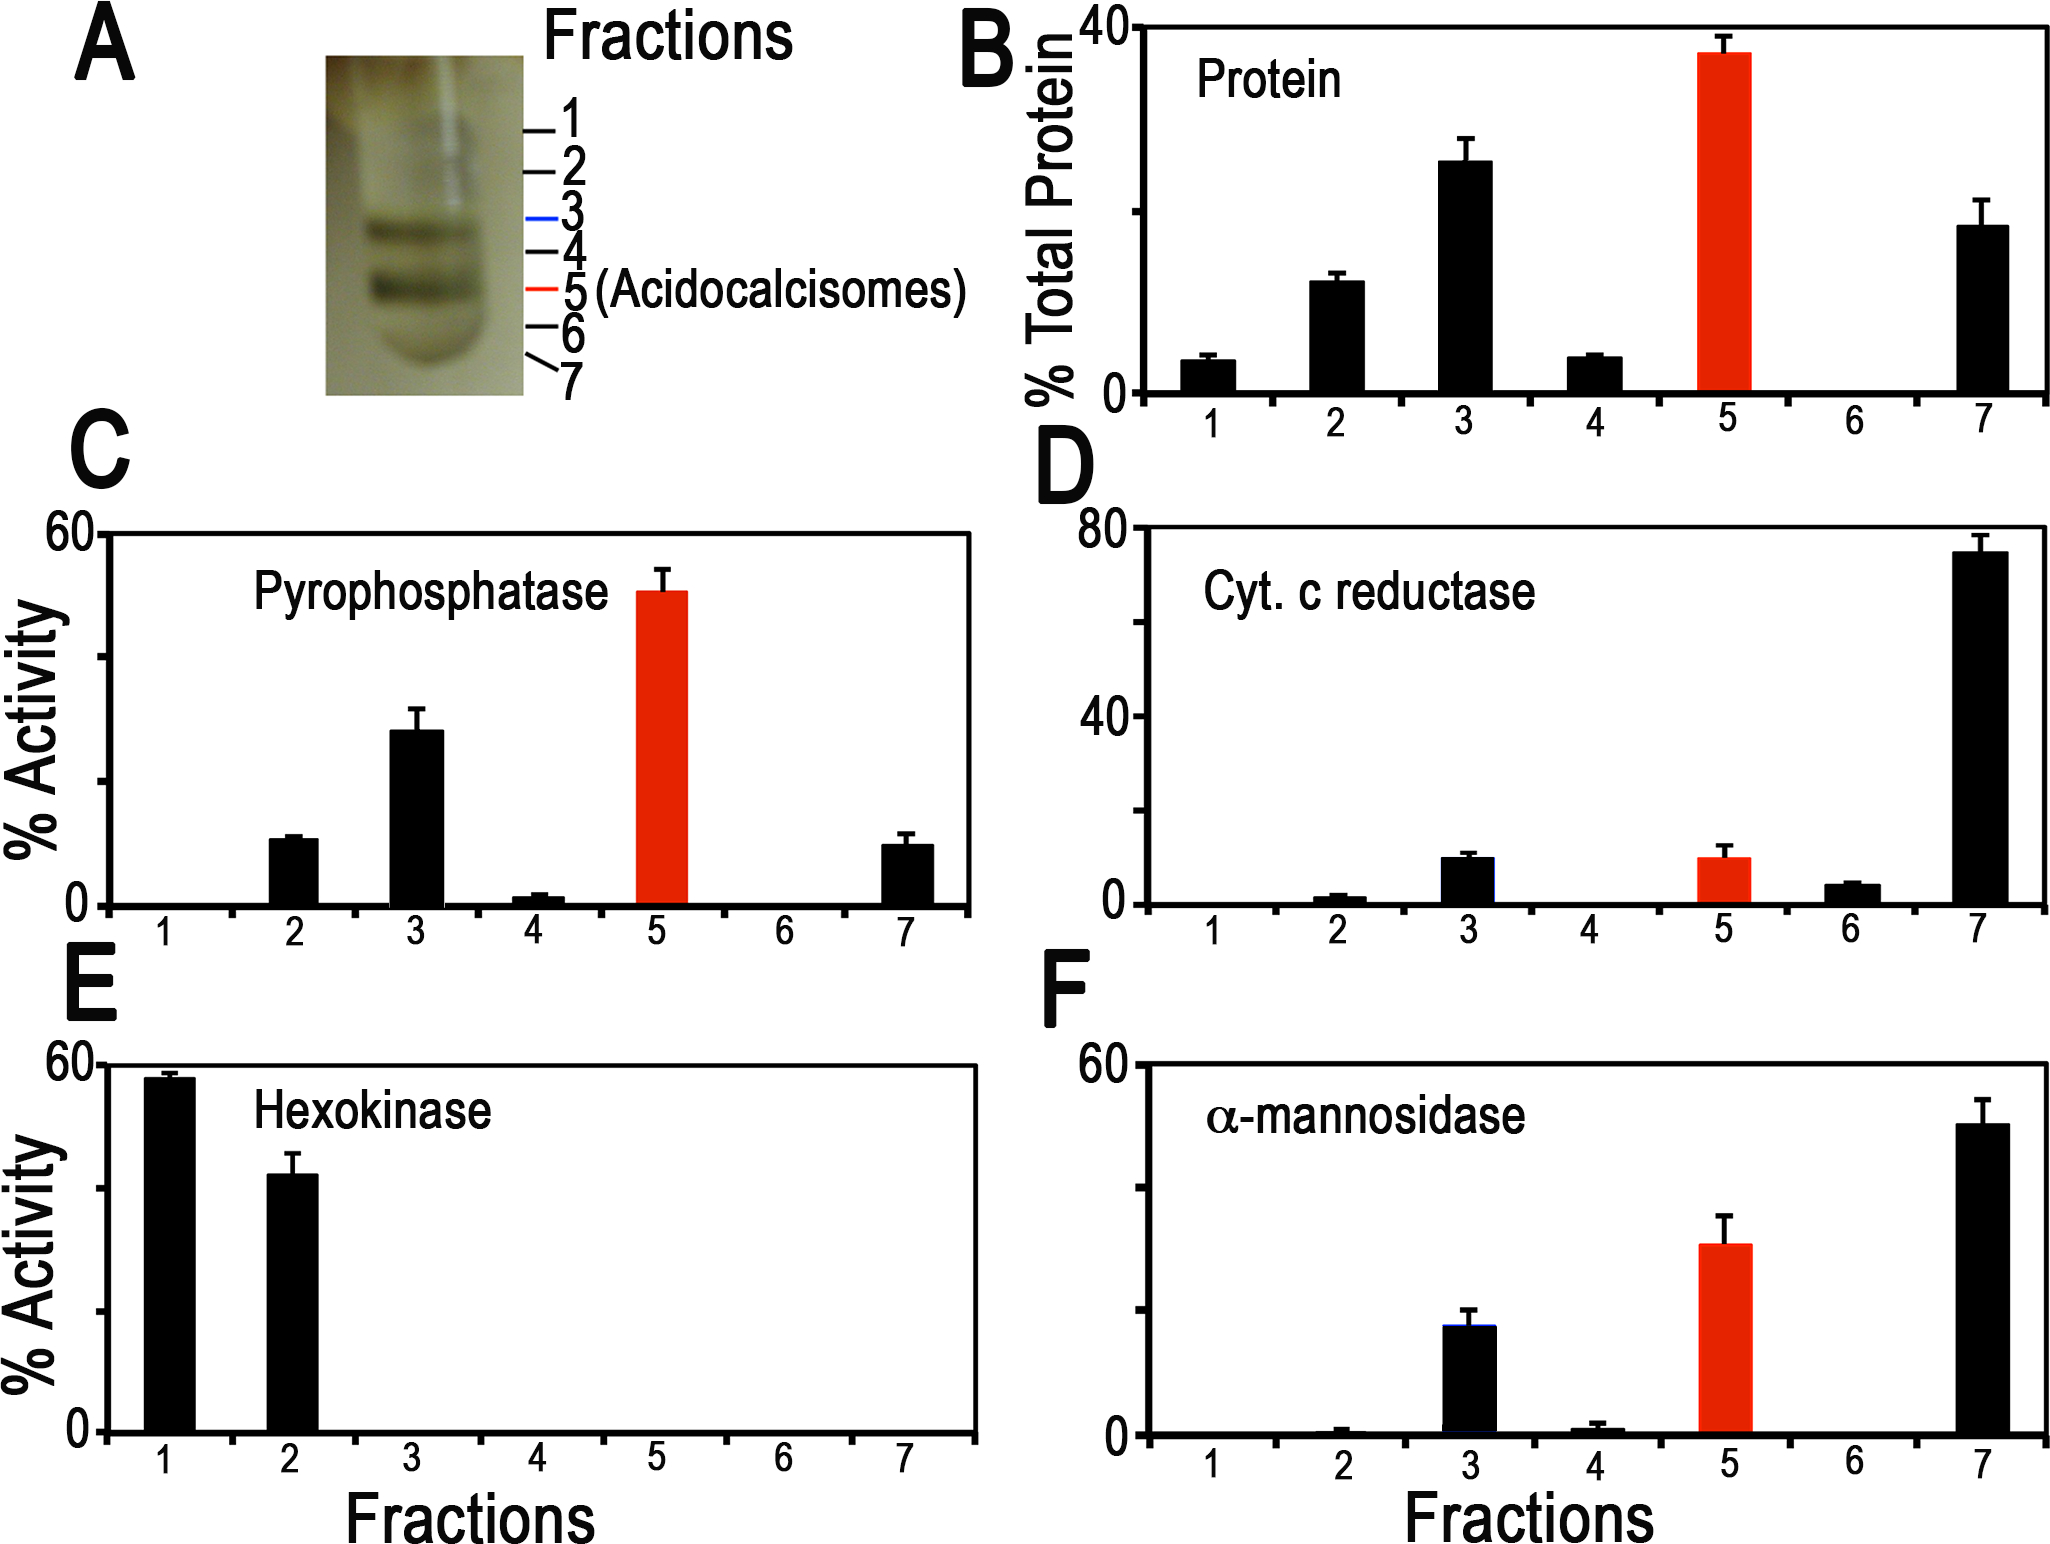
Fig. 2.

Distribution on iodixanol gradients of organellar markers from PCF trypanosomes. (a) Photograph showing bands obtained after the second iodixanol gradient centrifugation. Fraction 5 corresponds to the purified acidocalcisomes. (b) Protein distribution. (c) TbVP1 activity (measured as the AMDP-sensitive Pi release) is concentrated in fractions 3 and 5. (d) Mitochondrial marker distribution, succinate cytochrome c reductase. (e) Glycosomal marker distribution, hexokinase. (f) Lysosomal marker distribution, α-mannosidase. In (b-f) the y-axis indicates relative distribution; the x-axis indicates fraction number; bars show means ± SD (as a percentage of the total recovered activity) from two or three independent experiments (reproduced from Huang et al. (2014) (ref. 3) with permission from the Public Library of Science).
