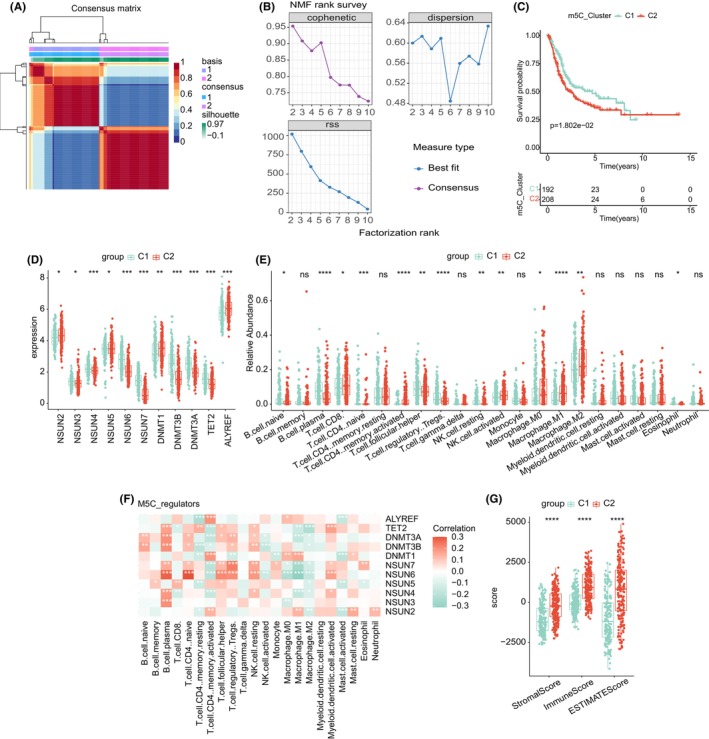
FIGURE 2.

(A) Consensus map of NMF clustering; (B) cophenetic, RSS and dispersion distributions with rank = 2–10; (C) OS survival curves of m5C clusters C1 and C2; (D) expression of 11 genes in two 5‐methylcytosine methylation modification clusters. ns, no significant difference; ***, p < 0.001. (E) Relative abundance of 22 immune cells in two 5‐methylcytosine methylation clusters. (F) The correlation between gene expression and relative abundance of 22 immune cells. The score of StromalScore, ImmuneScore and ESTIMATEScore between two 5‐methylcytosine methylation clusters. NMF, non‐negative matrix factorization; OS, overall survival; RSS, residual sum of squares.
