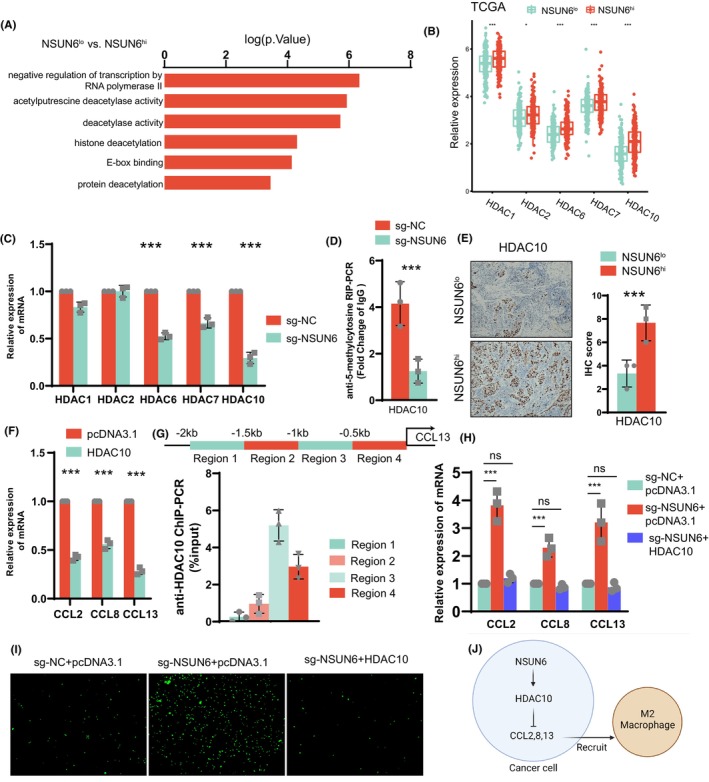
FIGURE 4.

(A) Patients in the TCGA‐BLCA dataset were divided into two groups according to the expression level of NSUN6 and subjected to differential gene expression analysis, and the results were subjected to GO pathway enrichment analysis. (B) Patients in the TCGA‐BLCA dataset were divided into two groups according to NSUN6 expression levels, and differences in HDAC family mRNA expression were analysed. (C) By PCR, it was found that the mRNA expression of HDAC family was significantly increased before and after sgRNA knockout of NSUN6. (D) qRT‐PCR shows, after knockout of NSUN6 by sgRNA, 5‐methylcytosine methylation of the CTCCA motif in the 3′‐UTR region of HDAC10 was upregulated significantly. (E) Immunohistochemical analysis of HDAC10 in 6 BLCA patients. (F) qRT‐PCR detection shows that the expression of macrophage‐related chemokines increased after overexpression of HDAC10. (G) ChIP‐PCR showed that HDAC10 was significantly bound to chromatin in a region 0.5–1 kb upstream of the CCL13 transcription start site. (H) qRT‐PCR showed that the downregulation of macrophage‐associated chemokine expression by sgRNA knockout of NSUN6 was reversed by HDAC10. (I) Co‐culture chemotaxis experiments of macrophages and tumour cells showed that the reduction of macrophage chemotaxis by sgRNA knockout of NSUN6 was reversed by HDAC10. (J) Mechanism of higher macrophage recruitment in BLCA patients with high NSUN6 expression.
