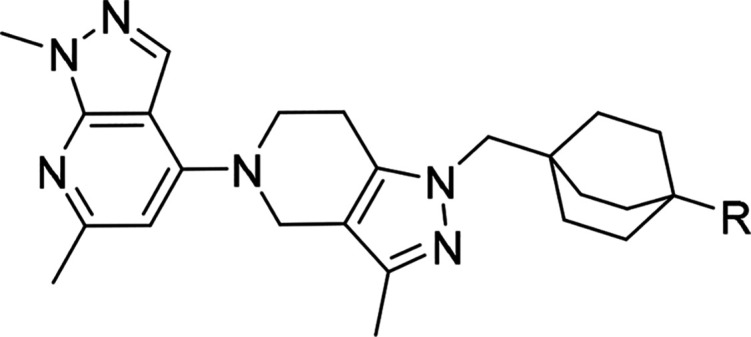
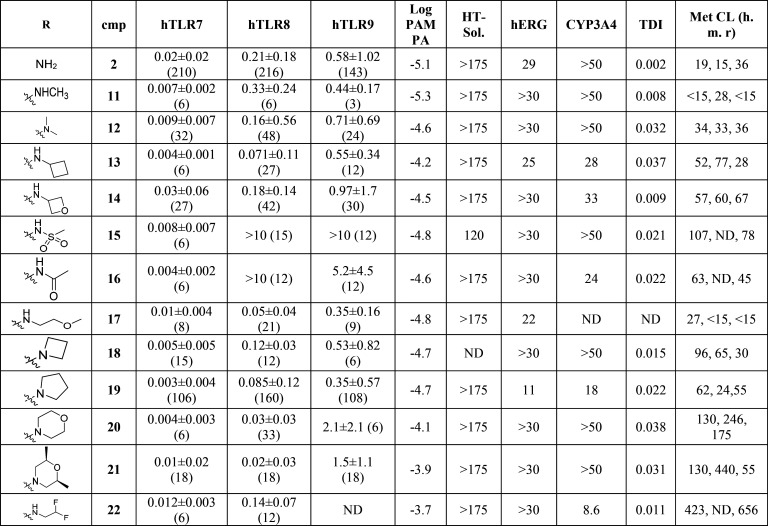
Table 2. Profiling Data of Compounds 2, 11–22a.

Potency in cellular assays for TLR7, TLR8, and TLR9 (PBMCs) as described in the Supporting Information. IC50 in μM ± geomeans; numbers in brackets denote number of independent experiments. HT solubility and CYP3A4 inhibition (μM), TDI: Kobs (min–1), hERG: 3H-dofetilite displacement assay (μM). Metabolic clearance: CLint (μL/min/mg). ND = not determined.

