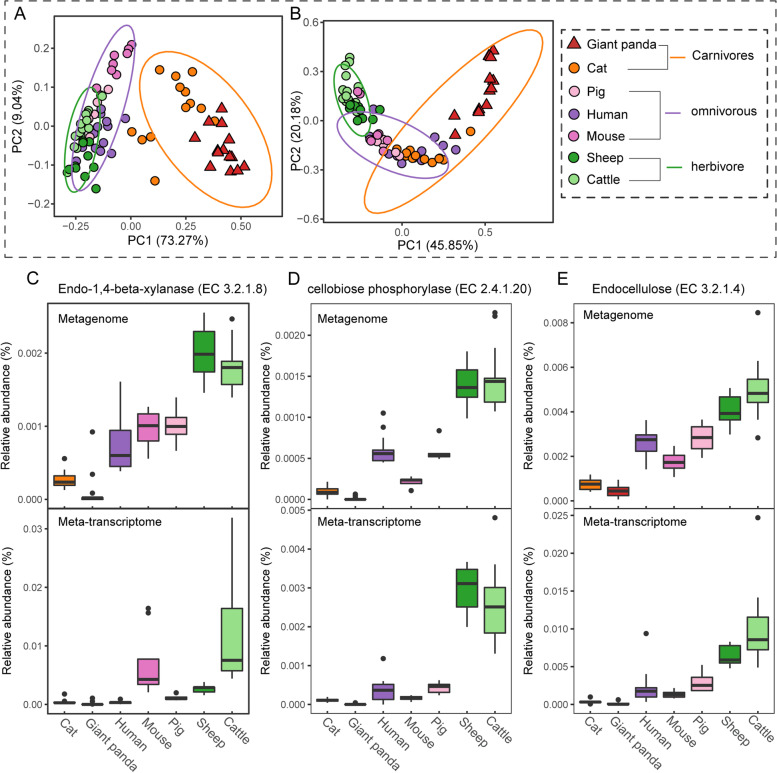
Fig. 3.
Composition and expression pattern of dietary fiber metabolic enzyme-related genes in the gut microbiota of different host species. Bray–Curtis diversity plot based on dietary fiber metabolic enzyme-related gene families. Bray–Curtis distance was measured by metagenomic abundance (A) and meta-transcriptomic expression (B) of these gene families. The ellipses were calculated and drawn with a 0.95 confidence level. Metagenomic abundance and meta-transcriptomic expression of crucial genes involved in hemicellulose degradation (EC 3.2.1.8, shown in C) and cellulase degradation (EC 3.2.1.4 and EC 3.2.1.20, shown in D and E) of different host species

