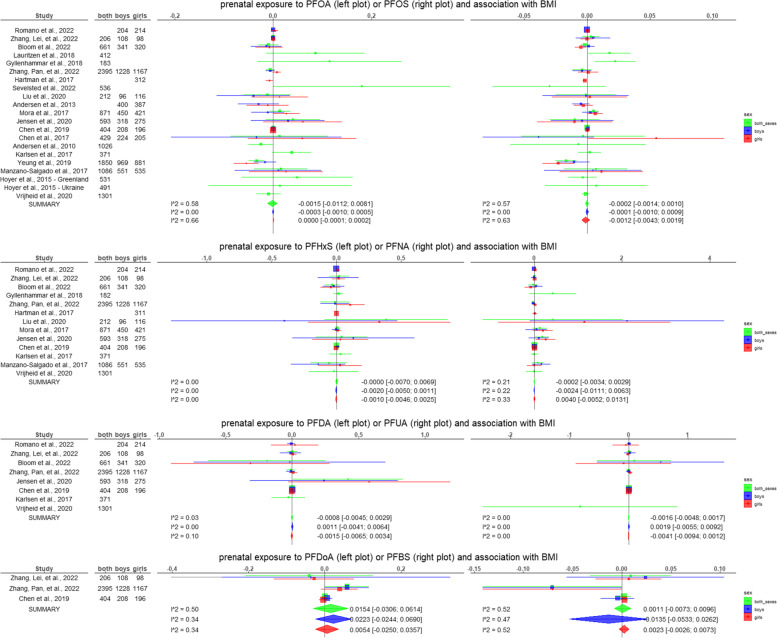
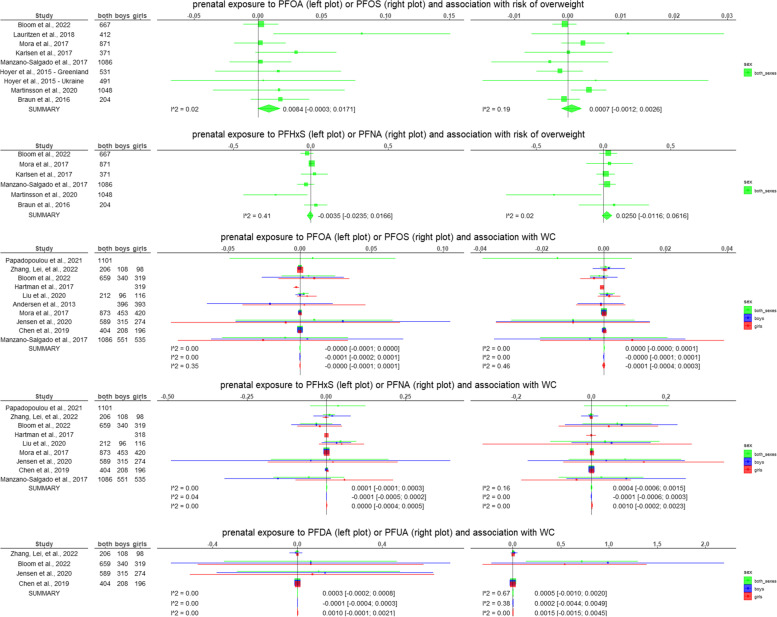
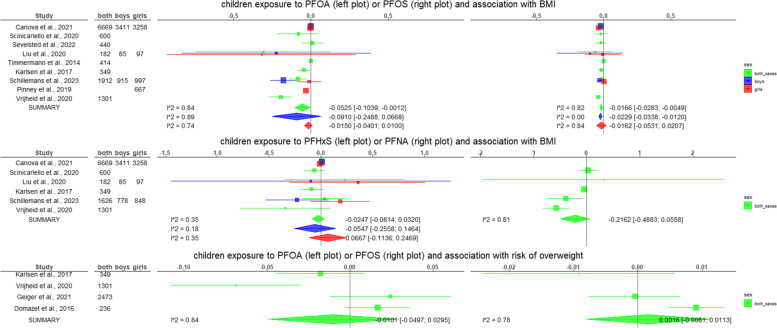
Fig. 2.
Superimposed forest plots of the meta-analyses performed with the inverse variance method considering separately both sexes, boys, and girls. The beta estimates represent the association between the increase of 1 z-score (of BMI or WC) per 1 ng/mL increase in the PFAS. For risk of overweight, the estimates represent transformed standardized mean differences (see section " 2.3.3 Data conversion of the effect estimates"). The squares are proportional to the weight assigned to each study in the random effects models, while horizontal lines represent the 95% confidence intervals reported. The diamonds at the bottom represent the pooled estimated of the random effects models (with the 95% confidence interval). The I2 is also reported as a measure of heterogeneity


