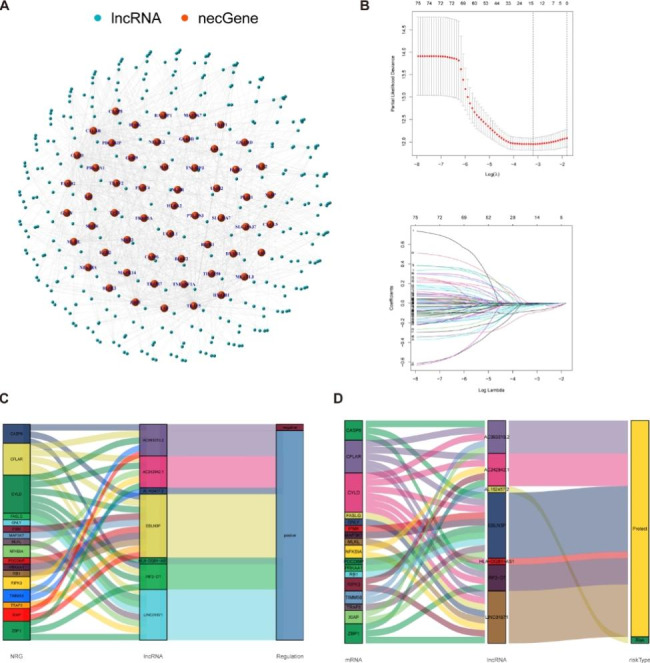
Fig. 2.

Identification of necroptosis-related lncRNAs in patients with melanoma. (A) The co-expression network between necroptosis-related genes and lncRNAs (correlation coefficients > 0.4 and p < 0.001). Orange nodes represent necroptosis-related genes, and the sky blue nodes represent their associated lncRNAs. (B) Cross-validation for tuning the parameter in the LASSO regression, the vertical dashed lines indicate are at the optimal log (lambda) value. (C) The Sankey diagrams were generated to visualize association networks between prognostic lncRNAs, necroptosis-related genes and regulate status (positive/negative). (D)The correlation network of prognostic necroptosis-related lncRNAs and associated mRNAs (risk / protect)
