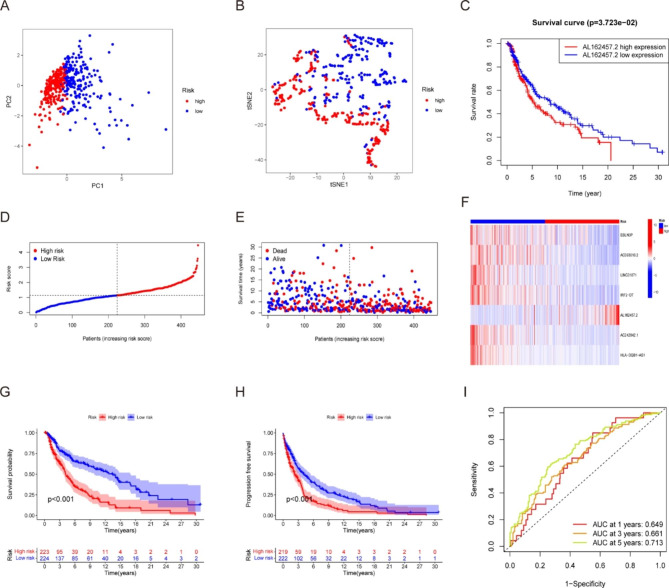
Fig. 3.
Evaluation of a necroptosis-related signature for melanoma prognosis prediction. (A) Principal component analysis (PCA) of melanoma patients according to the risk score. (B) T-distributed Stochastic Neighbor Embedding (t-SNE) of melanoma patients according to the risk score. (C) Survival curve of melanoma patients with high and low AL162457.2 expression. The distribution of the risk scores (D), overall survival status (E), and the expression of necroptosis-related lncRNAs (F) among melanoma patients was shown. (low-risk population: on the left side of the dotted line; high-risk population: on the right side of the dotted line; green represents the number of survivors, and red represents the number of deaths. The risk from low to high reveals a rising tendency in deaths). Kaplan-Meier overall survival (G) and progression-free survival (H) curves of the risk stratification groups and the shaded area represent the 95% confidence interval (CI). The clinical outcome in the high-risk group was inferior to those in the low-risk group. (I) The area under the curve (AUC) value of the time-dependent ROC curves shows the predictive performance of the risk score, with the 1-year, 3-year, and 5-year AUC being 0.649, 0.661 and 0.713, respectively

