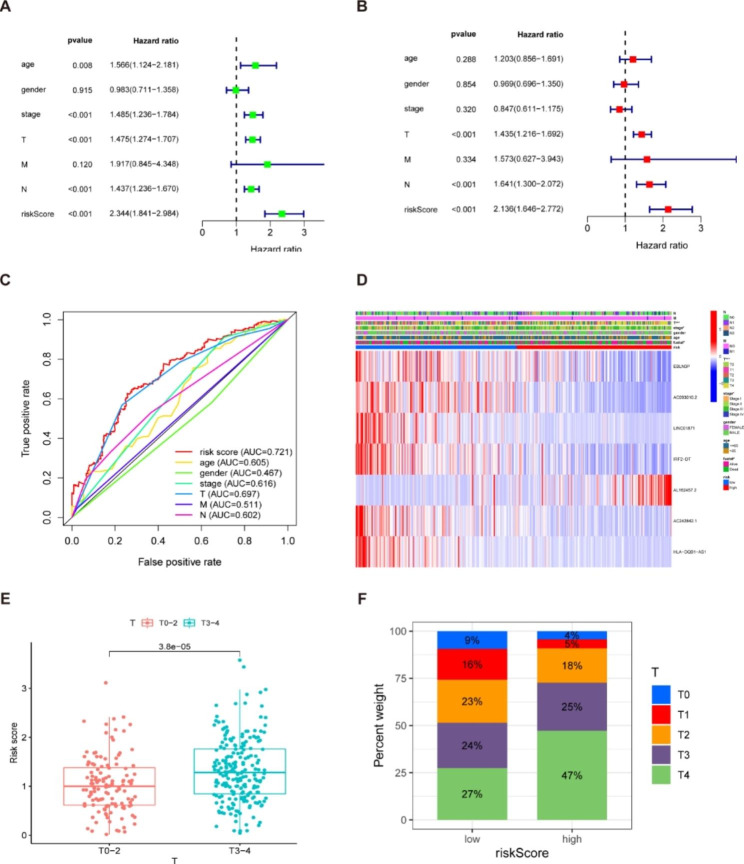
Fig. 4.
Prognostic values of clinicopathological factors and risk score. (A) Univariate Cox regression analysis showed that stage, T, N, and risk score were independent factors for melanoma prognosis. (B) Multivariate Cox regression demonstrated that T, N, and risk score were independent prognostic predictors. The risk score is the parameter with the highest HR value in univariate or multivariate Cox analysis. (C) The ROC curve of the risk score had the largest AUC of 0.721 compared with the other clinical variables. (D) Heatmap (blue: low expression; red: high expression) for the relationship between clinicopathologic characters and the risk groups, indicating that survival status, T, and stage were significantly different between the two groups. (E) Correlation analysis between risk score and T status. Patients with melanoma of stage T3-4 had substantially higher risk scores than those with stage T1-2. (F) The distribution of T-stage in high- and low-risk populations. Note: *** P ≤ 0.001. ** P ≤ 0.01. * P ≤ 0.05

