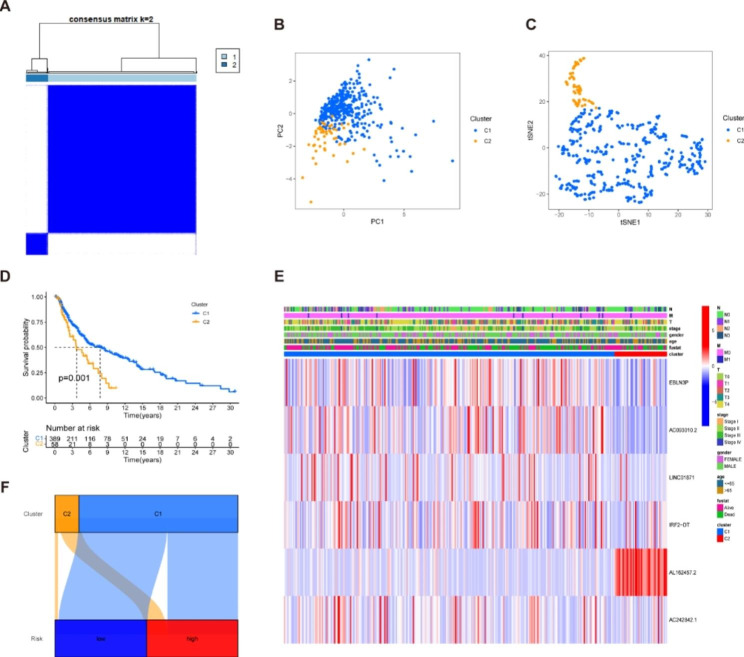
Fig. 6.
Tumor classification was based on the identified prognostic NRLs. (A) 447 melanoma patients were stratified into two clusters according to the consensus clustering matrix (k = 2). (B-C) Principal component analysis (PCA) and t-distributed Stochastic Neighbor Embedding (t-SNE) algorithm and for clusters. (D) Kaplan–Meier curves show C1(blue) and C2 (yellow) survival for melanoma patients. C2 has a worse prognosis than C1 (P = 0.001). (E) Heatmap and the clinicopathologic characters of the two clusters. (F) Sankey diagram of the relationship between the two clusters and risk groups. Note: *** P ≤ 0.001. ** P ≤ 0.01. * P ≤ 0.05

