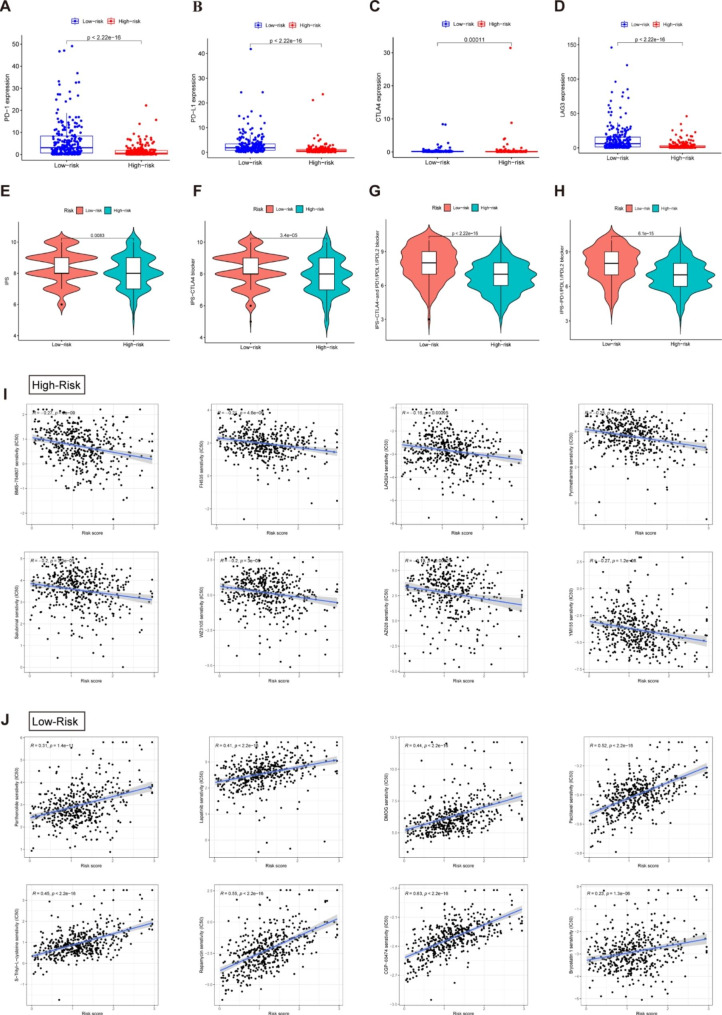
Fig. 8.
Prediction of immunotherapy response and chemotherapy drug sensitivity in melanoma patients. Comparison of expression levels of critical genes such as PD-1 (A), PD-L1 (B), CTLA4 (C) and LAG3 (D) for immune checkpoint inhibitors among distinct risk groups. (E-H) The estimation of immunotherapy response between high- and low-risk score groups. Orange represents the low-score group, and Cyan represents the high-score group. The thick line within the violin plot represents the median value. The inner box between the top and bottom represents the interquartile range. (I) Comparisons of IC50 for chemotherapeutics between two subgroups revealed that the high-risk group was more likely to benefit from BMS-754,807, FH535, LAQ824, etc. (J). The low-risk group was more sensitive to Parthenolide, Lapatinib, DMOG, etc.

