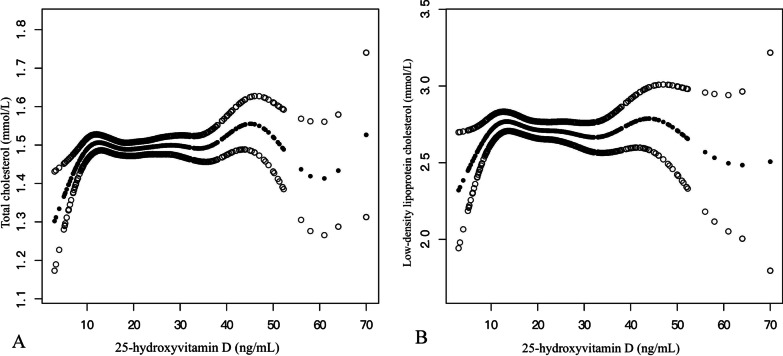
Fig. 2.
Adjusted smoothed curves corresponding to the relationship between 25(OH)D levels and TC (A), LDL-C (B). A generalized additive model revealed a threshold nonlinear relationship between 25(OH)D and TC, LDL-C in OP patients. The upper and lower curves represent the range of the 95% confidence interval, and the middle curve represents the correlation between 25(OH)D and TC, LDL-C. Models were adjusted for Sex; Age of blood collection; Year of blood collection; Calcium; BMI; Season; Main diagnosis; Hypertension; Diabetes; β-CTX. The middle curve exhibited an inflection point (K) at 10.04 ng/mL. 25(OH)D 25-hydroxy vitamin D, TC total cholesterol, LDL-C low-density lipoprotein, BMI body mass index, β-CTX beta-C-terminal telopeptide of type I collagen

