Fig. 2.
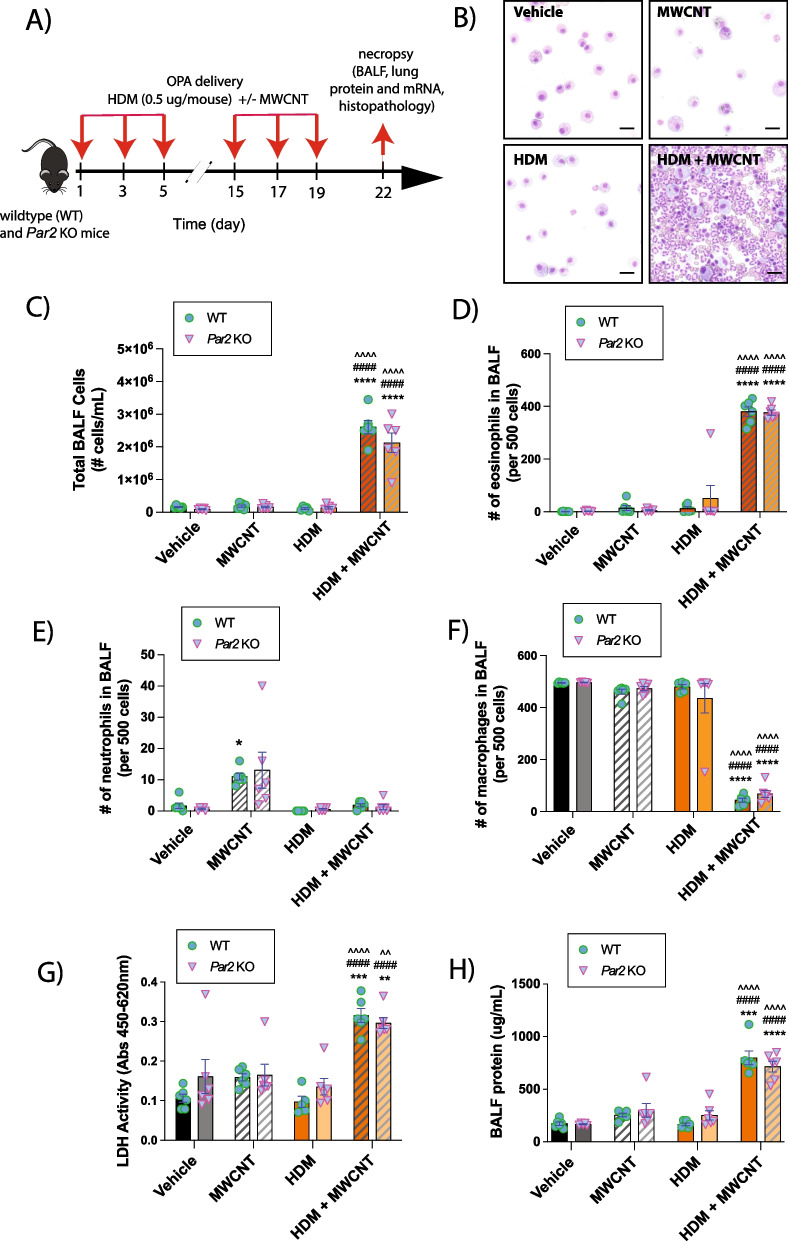
Cellularity analysis and biomarkers of lung injury in BALF collected from WT and Par2 KO mice exposed to HDM extract and MWCNTs. A Graphical representation of the experimental protocol. B Representative images of cytospins of BALF from WT mice showing increased eosinophilic inflammation after co-exposure to MWCNTs and HDM extract. Black bars = 10 µm. C Total inflammatory cell numbers in the BALF collected from mice exposed to low dose (0.5 µg per dose) of HDM extract with or without MWCNTs via oropharyngeal aspiration. Differential cell counts in BALF expressed as relative number per 500 cells: D Eosinophils. E Neutrophils. F Macrophages. G BALF LDH activity. H BALF total protein. n = 6. ****p < 0.0001, ***p < 0.0001, **p < 0.01, *p < 0.05 when compared to respective vehicle control groups, ^^^^p < 0.0001, ^^p < 0.01 when compared to respective HDM groups, and ####p < 0.0001 when compared to respective MWCNT groups as determined by two-way ANOVA with Tukey’s post hoc analysis

