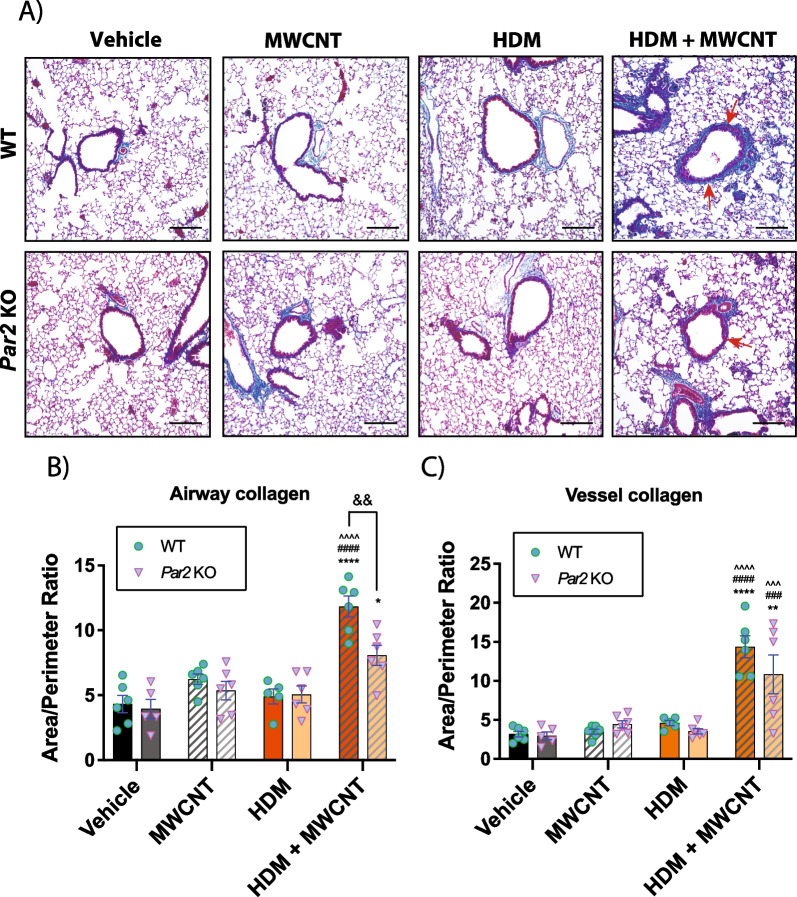
Fig. 3.
Airway and vessel fibrosis in the lungs of WT and par2 KO mice exposed to HDM and MWCNTs. A Representative images of trichrome stained lung sections. B Quantification of area to perimeter ratio around airways of Gomori’s trichome stained lung sections. C Quantification of area to perimeter ratio around major blood vessels of Gomori’s trichome stained lung sections. n = 6. ****p < 0.0001, ***p < 0.001 when compared to respective vehicle control groups, ^^^^p < 0.0001, ^^^p < 0.001 when compared to respective HDM groups, ####p < 0.0001, ##p < 0.01 when compared to respective MWCNT groups, &&p < 0.01 when compared to genotypical counterpart as determined by two-way ANOVA with Tukey’s post hoc analysis. Magnification bars in each panel = 100 µm

