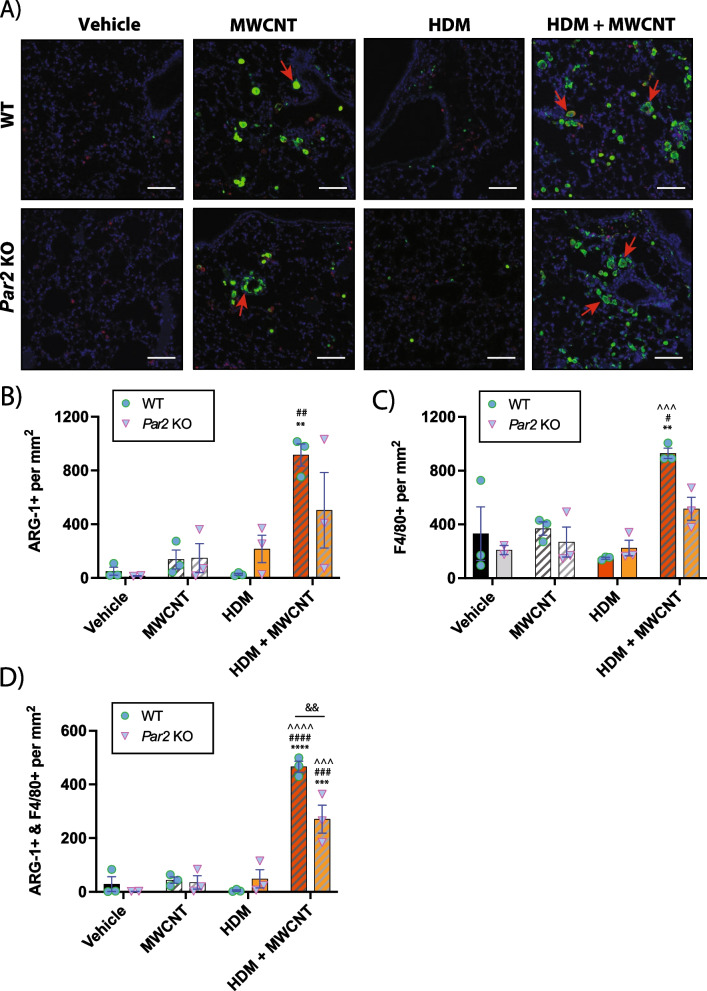
Fig. 6.
Immunohistochemistry for localization of ARG-1 and F4/80 in tissue sections from WT and Par2 KO mice exposed to MWCNTs, HDM extract or MWCNTs and HDM extract. A Representative microscopic images of lung tissue showing ARG-1 + cells (green), F4/80 + cells (red), and DAPI + cells (blue). Red arrows indicate ARG-1 + mononuclear cells associated with MWCNTs. White bars = 50 µm. B Semi-quantitative analysis derived from Definiens software showing the numbers of ARG-1 + cells per mm2 lung tissue sections per animal. C Numbers of F4/80 + cells per mm2 lung tissue per animal analzed by Definiens software. D Numbers of ARG-1 + and F4/80 + cells per mm2 lung tissue per animal analzed by Definiens software. The data represent 3 animals per group for each genotype

