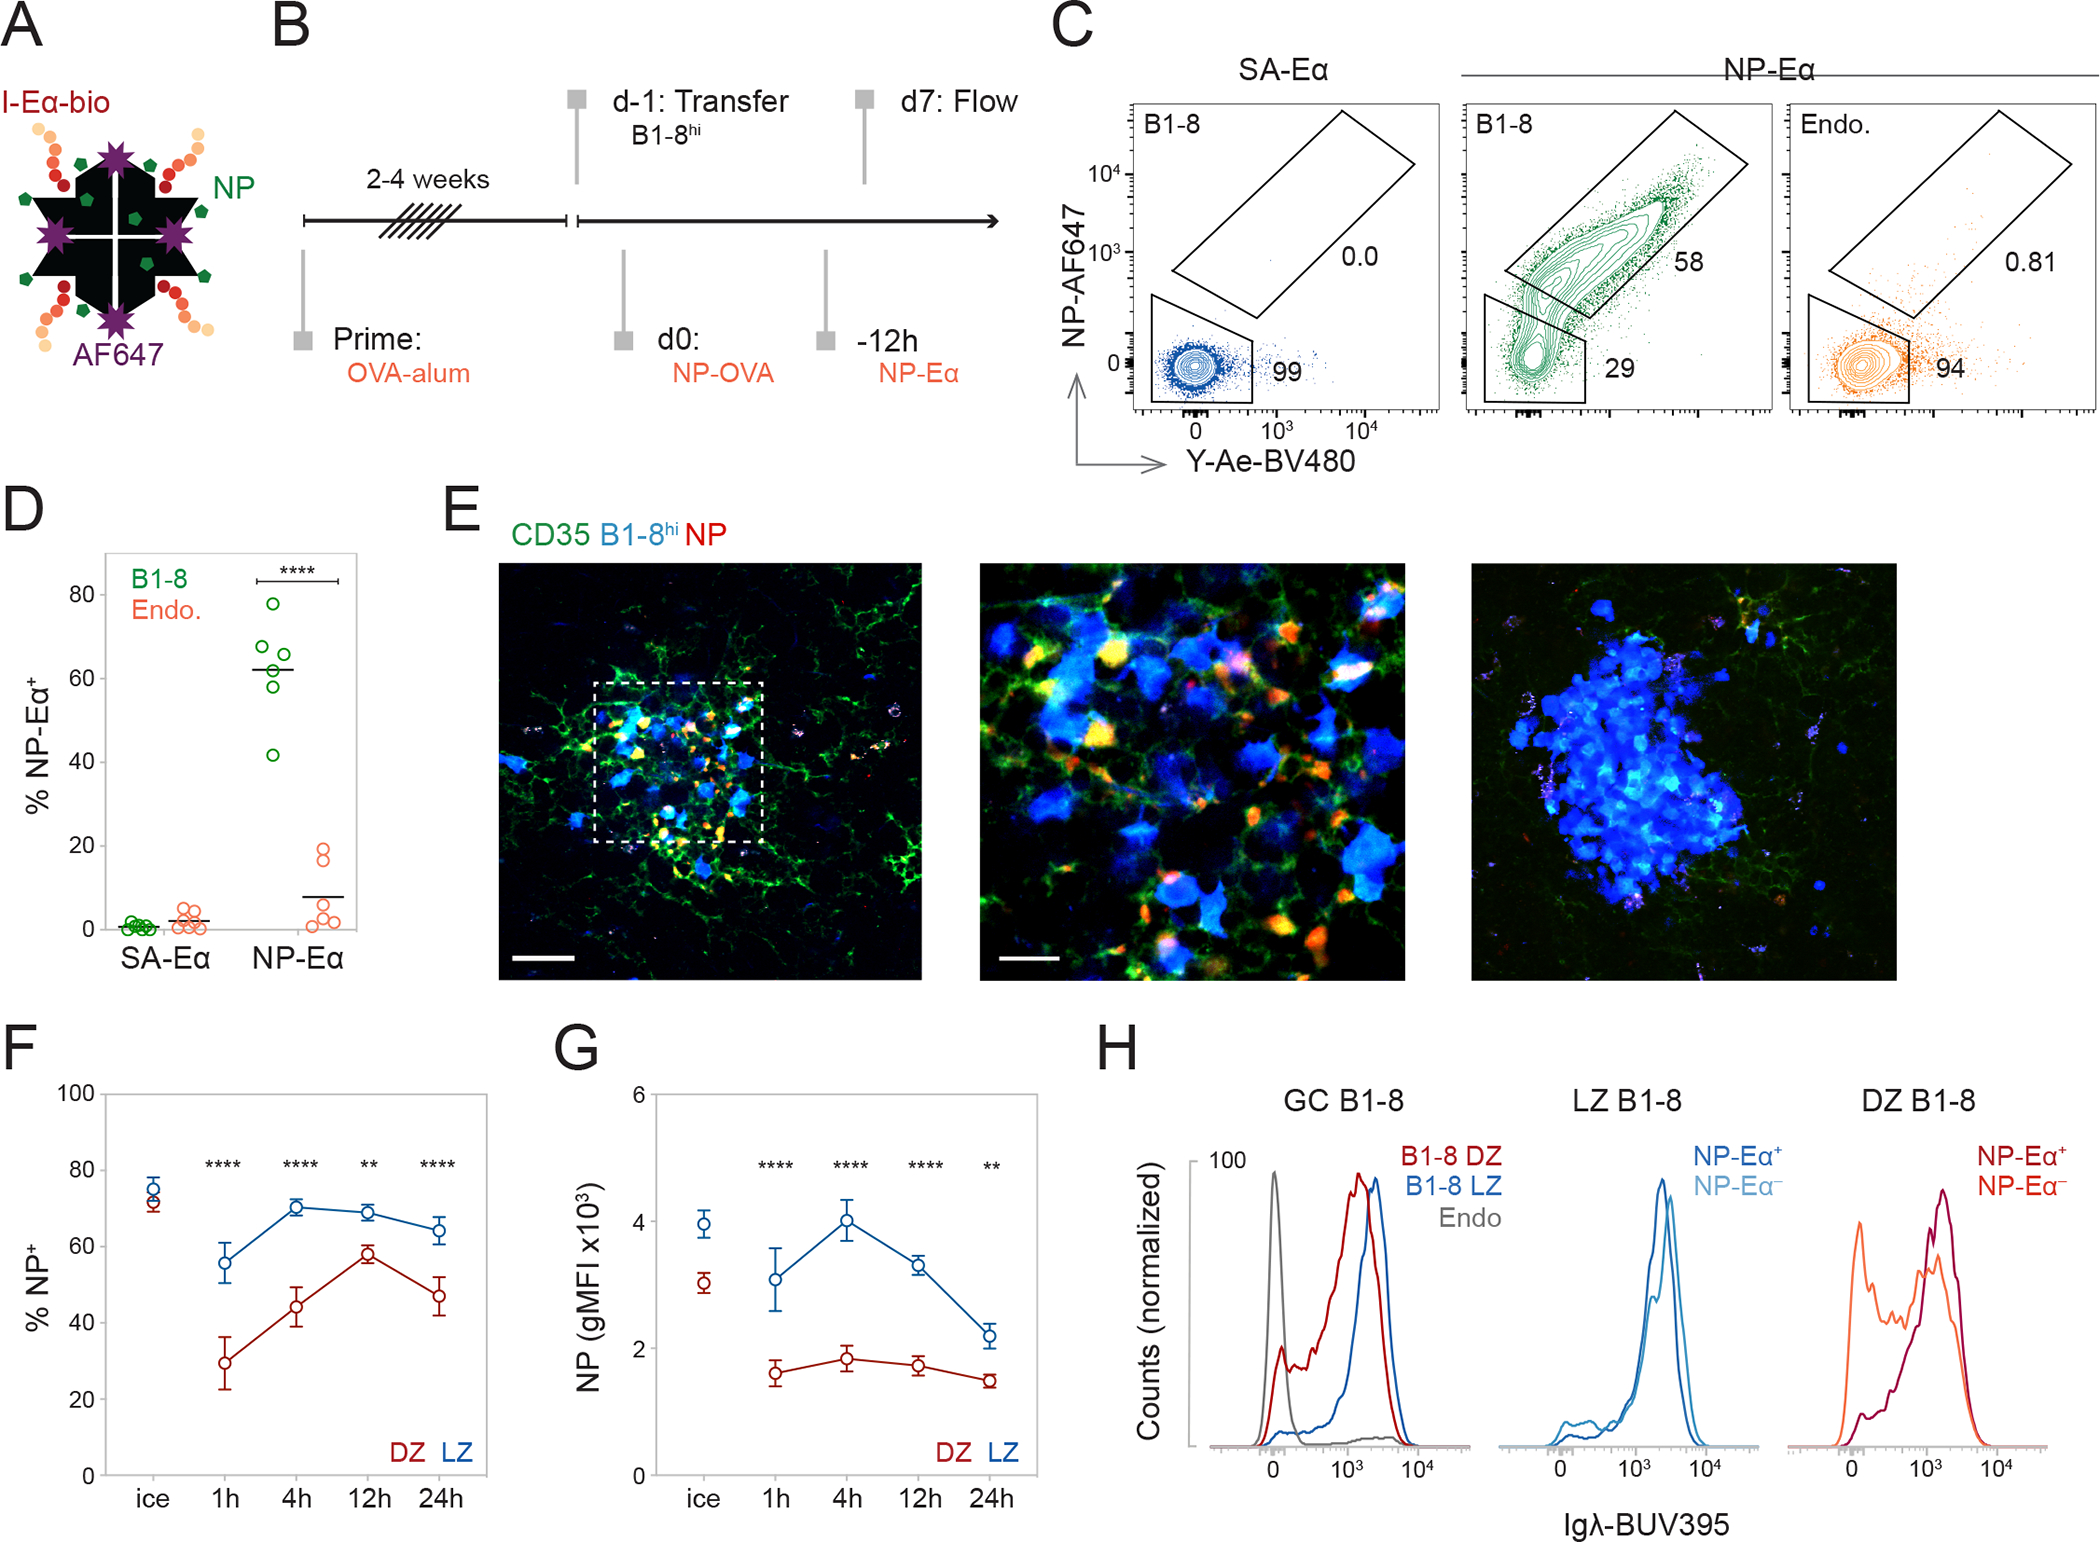
Figure 1. NP-Eα tracks antigen binding and presenting GC B cells in a BCR-specific manner.

(A) Cartoon representation of NP-Eα. (B) Experimental setup. (C) Representative flow cytometry plots showing internalization and presentation of SA-Eα or NP-Eα by GC B cell populations. (D) Frequency of NP+Y-Ae+ (NP-Eα+) among B1-8hi or host (Endo.) B cells after injection of 7NP-Eα or SA-Eα, ****p<0.0001. (E) Multiphoton images of GCs after prime-boost and transfer of B1-8hi-CFP cells. αCD35-AF488 and 7NP-Eα-AF594 were injected intravenously (i.v.) and subcutaneously (s.c.), respectively, 24 hours (h) before imaging. LZs were identified by the presence of FDC networks labeled with αCD35. LZ (leftmost panel); inset of LZ as marked with the dashed line (center); and DZ (rightmost panel). (F) Percentage of NP+ cells (**p=0.0010, ****p<0.0001) and (G) Geometric mean fluorescence intensity (gMFI) of NP-AF647 (**p=0.0023, ****p<0.0001) of DZ and LZ labeled with 7NP-Eα on ice or in vivo over time (H) Representative histograms showing Igλ expression of GC populations. (D, F, and G) Data from two independent experiments. Each dot represents one mouse and lines depict mean (D). Dots represent means and error bars, SEM (F and G). P values calculated using two-tailed paired t test (D) and RM two-way ANOVA with Šidák’s multiple comparisons (F and G). See also Figure S1.
