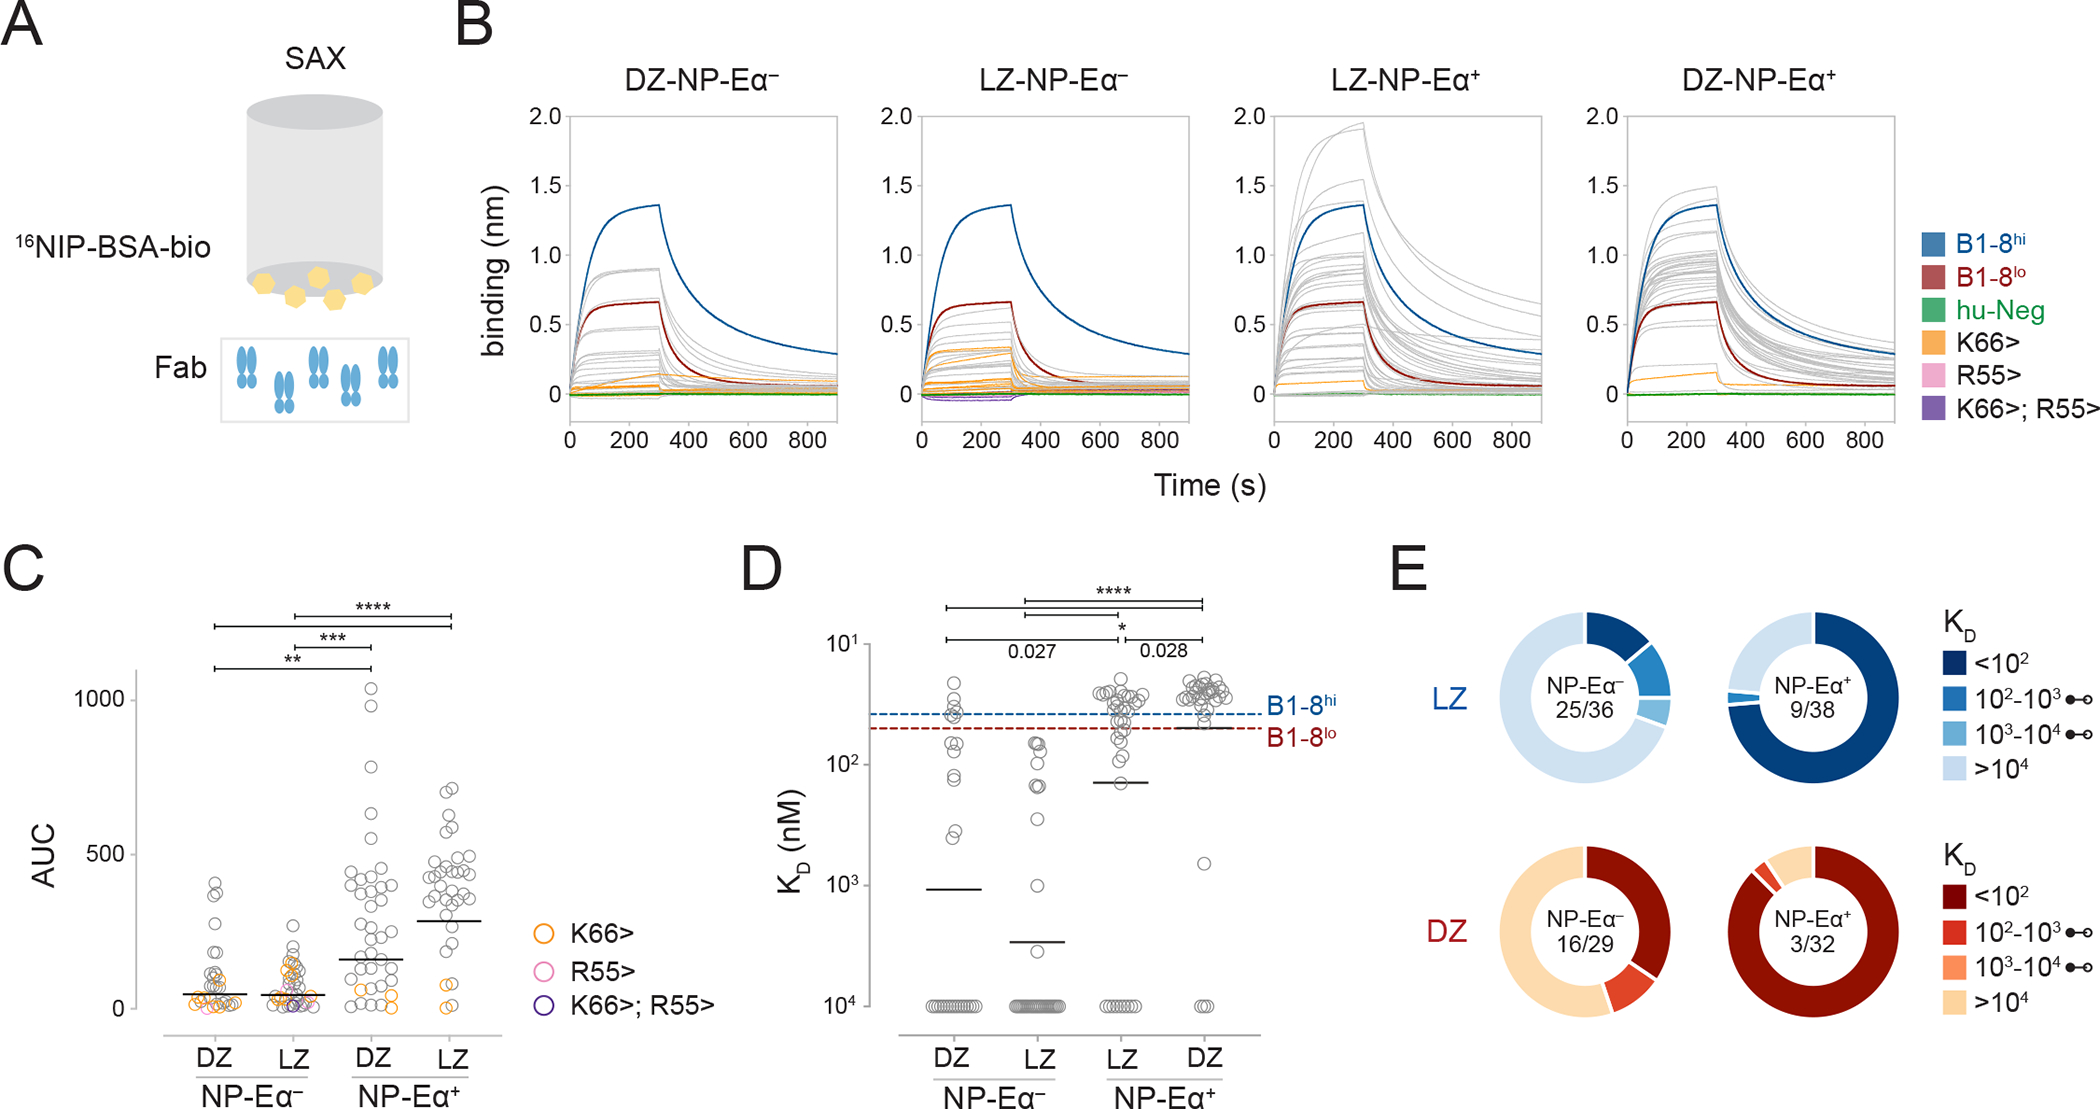
Figure 3. Binding affinities of Fabs produced from LZ and DZ B cells.

(A) Monovalent bio-layer interferometry (BLI) setup. (B) BLI traces of Fabs [50nM] from LZ- and DZ-NP-Eα+ and -NP-Eα− compartments under monovalent setup. (C) Area Under the Curve (AUC) calculations of BLI traces from (B), **p=0.0027, ***p=0.0002, ****p<0.0001. (D) KD measurements of Fabs from LZ- and DZ-NP-Eα+ and −NP-Eα− compartments. Fabs with no detectable binding were assigned KD values of 10 μM, *p values as indicated, ****p<0.0001. (E) Distribution of KD values of Fabs from LZ and DZ NP-Eα+ and NP-Eα− compartments. Fraction in middle denotes the number of Fabs with undetectable binding out of the total. Each dot represents one Fab with lines denoting geometric means (C and D). P values (C and D) calculated with Kruskall-Wallis with Dunn’s multiple corrections test. See also Figure S2.
