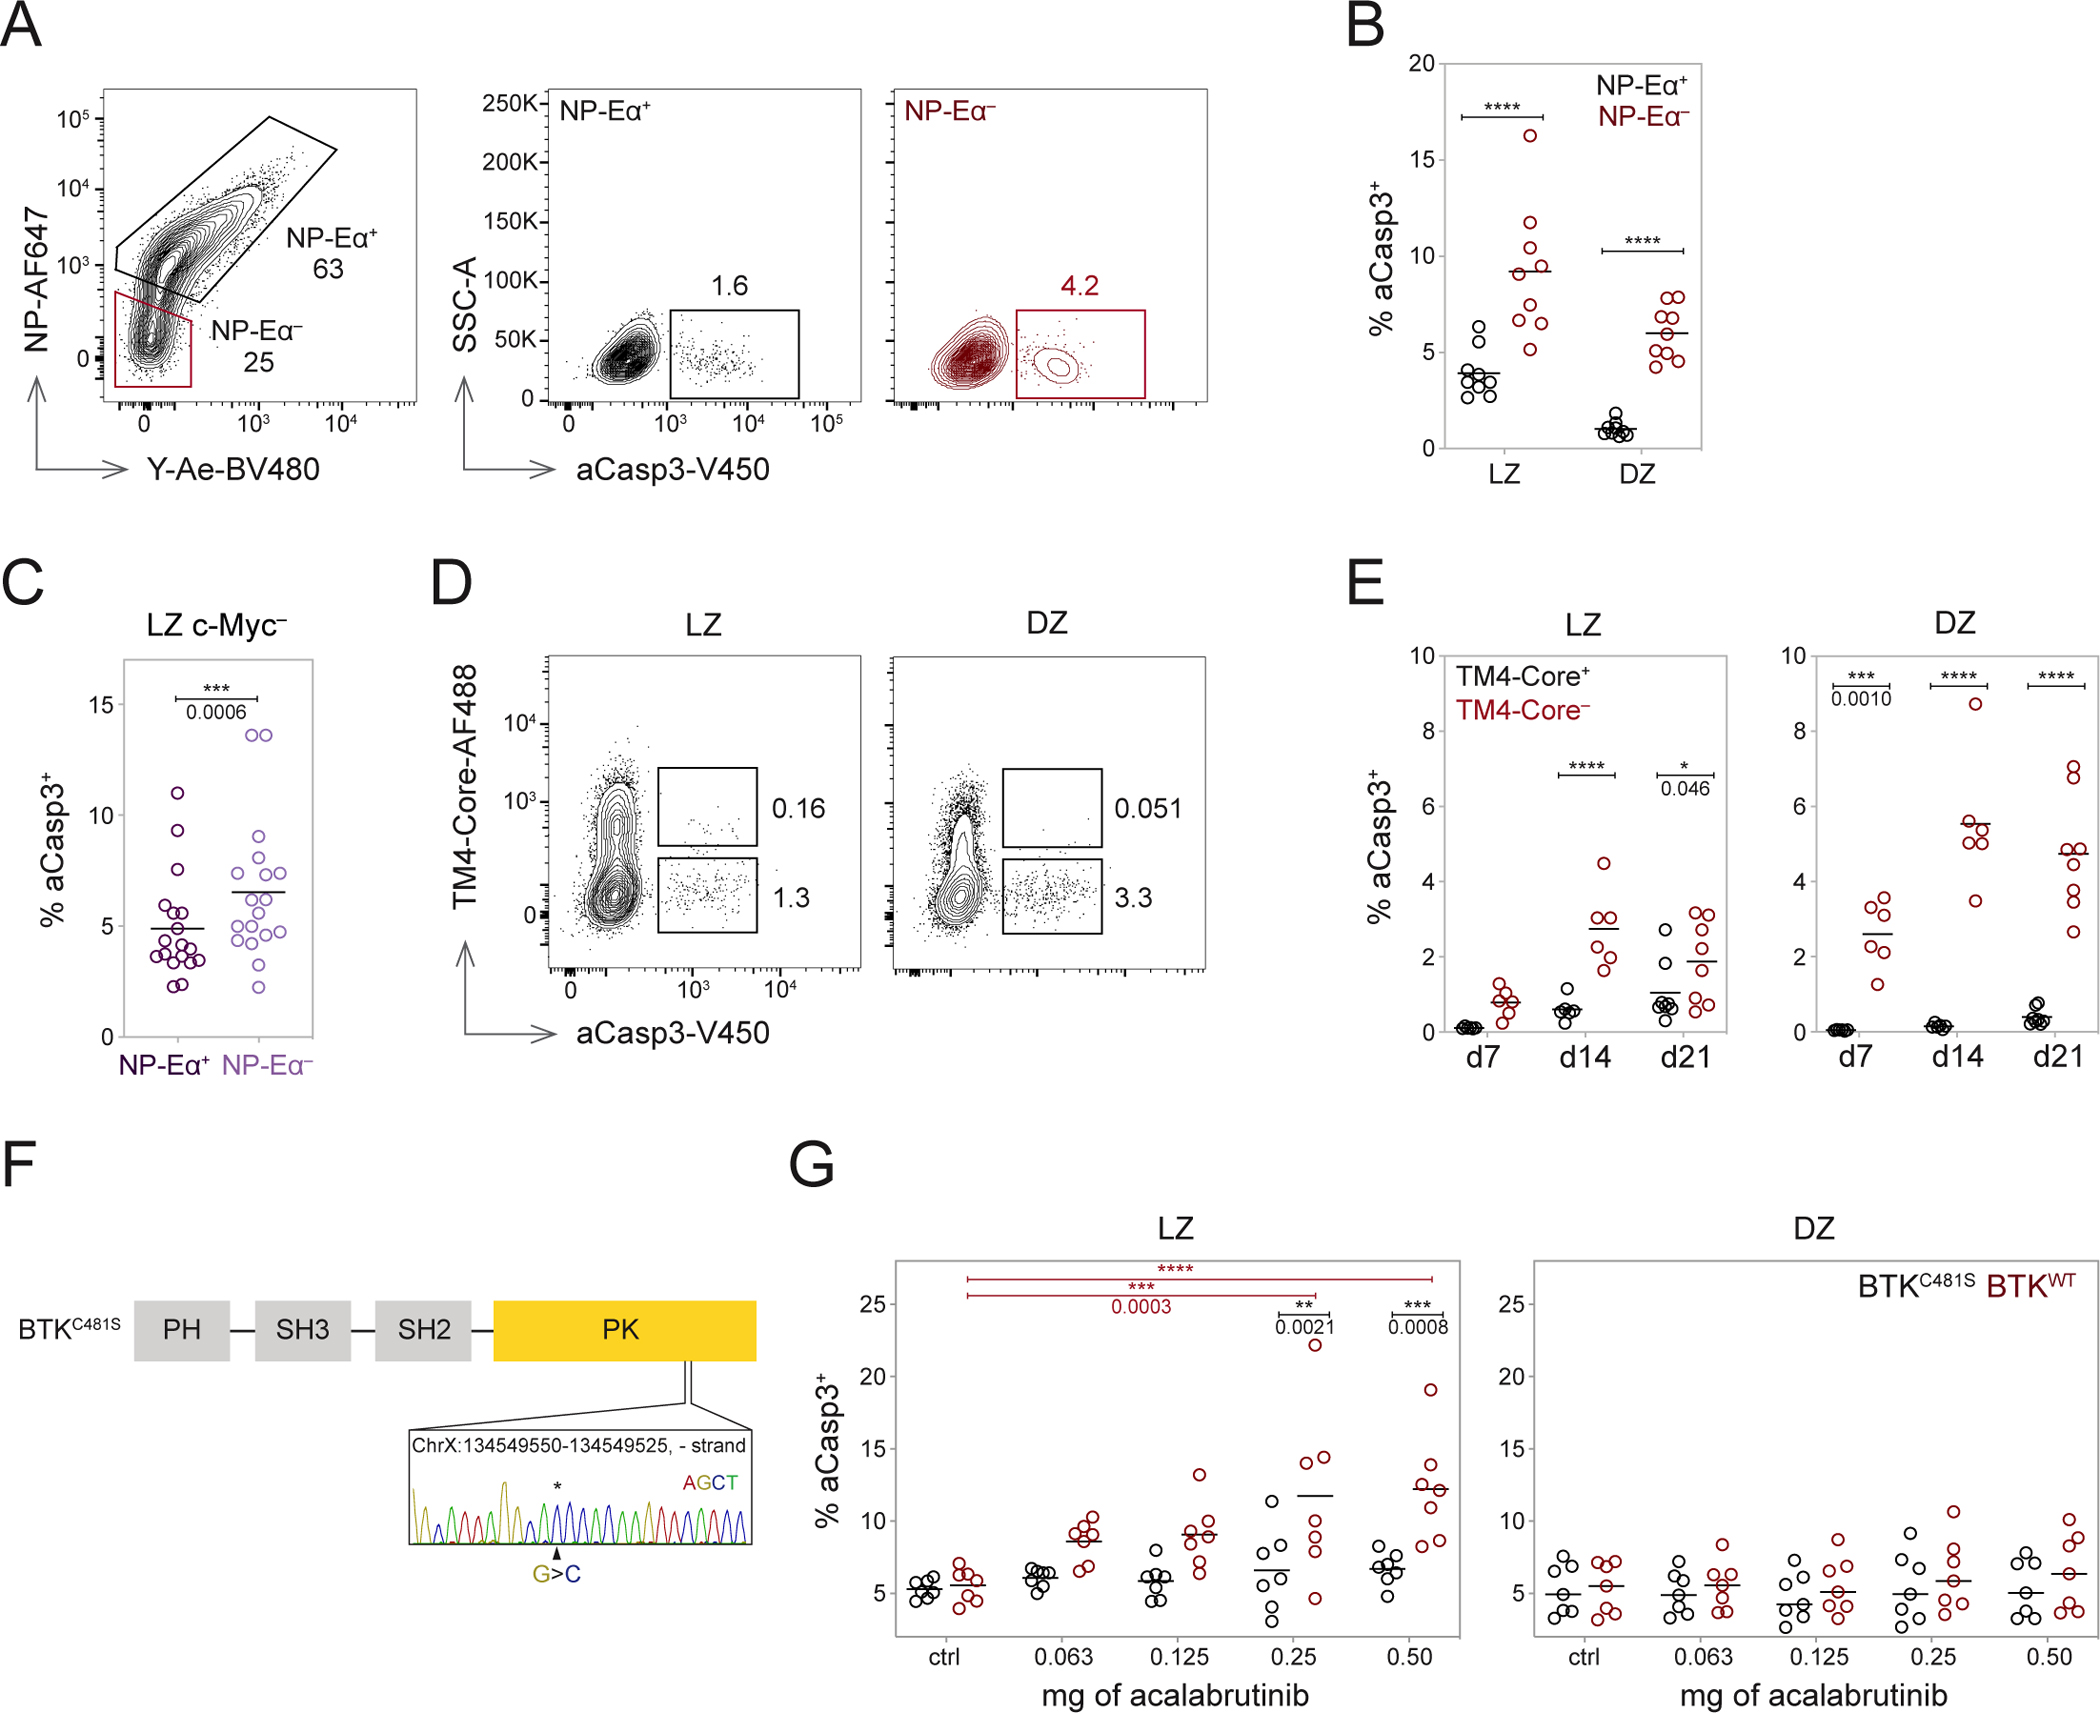
Figure 5. BCR engagement is necessary for B cell survival in the LZ.

(A) Representative gating of aCasp3+ cells among NP-Eα+ and NP-Eα− B1-8hi cells. (B) Frequency of aCasp3+ cells among NP-Eα+ (black) and NP-Eα− (red) cells labeled in vivo with 14NP-Eα, ****p<0.0001. (C) Frequency of aCasp3+ cells among c-Myc− NP-Eα+ and c-Myc− NP-Eα− LZ B1-8hi cells, two-tailed paired t test, ***p=0.0006. (D) Plots depicting aCasp3+ cells among TM4-core binding and nonbinding populations. (E) Frequency of aCasp3+ cells among TM4-core binding and nonbinding population over time, gated on LZ or DZ, then TM4-core+ or TM4-core−, *p=0.046 ***p=0.0010, ****p<0.0001. (F) Knock-in BTKC481S point mutation. (G) Frequency of aCasp3+ cells among BTKC481S and BTKWT cells in the LZ (left) and DZ (right) with acalabrutinib treatment, two-way ANOVA with Šidák’s multiple comparisons (within dose) or Tukey’s multiple comparisons (across doses), ** and ***p values as marked, ****p<0.0001. Data from two (E and G), three (B), and five (C) independent experiments. Each dot represents one mouse, and lines depict means (B, C, E, and G). P values (B and E) calculated with RM two-way ANOVA with Šidák’s multiple comparisons. See also Figures S5.
