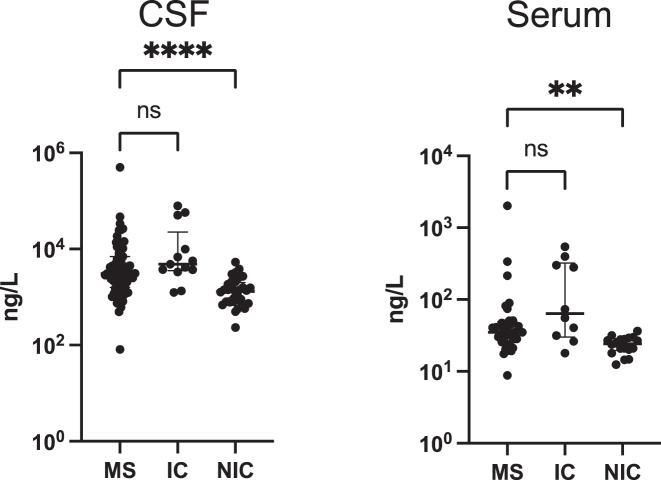
Figure 1:
Quantitation of CSF(c) and serum(s) NfL in all study subjects measured with MSD’s ECL technology. Graphs demonstrate higher levels of cNfL and sNfL in MS patients compared to non-inflammatory controls (NIC), but similar levels to inflammatory controls (IC). Asterisks indicate significance from pairwise post-hoc comparisons between MS and control groups, following a Kruskal–Wallis test. **p<0.01, ***p<0.001. Bars show median with interquartile range on concentration values (ng/L). CSF sample size: n=71 MS; 32 NIC; 13 IC. Serum sample size: n=33 MS; 18 NIC; 10 IC. ns, non-significant.

