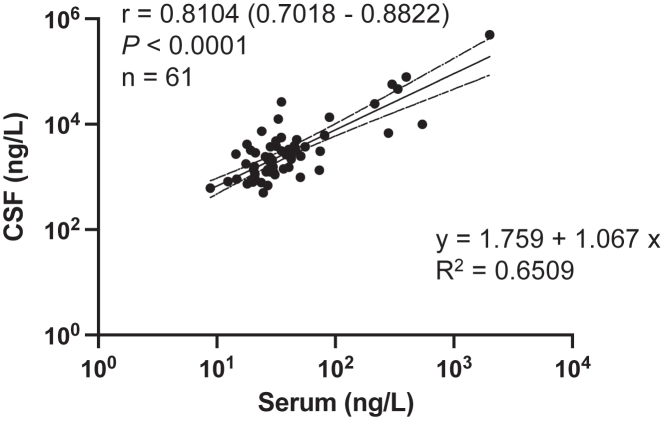
Figure 2:
Strong and significant correlation of serum and CSF NfL as measured with MSD’s ECL technology. Number of subjects is indicated by n [n=33 (MS); 10 (inflammatory control); 18 (non-inflammatory control)] and r is the Pearson correlation coefficient (with 95% confidence interval) on log-transformed concentration data. The equation that best represents the linear relationship of NfL measurements between serum and CSF is shown along with adjusted R2 values representing the goodness of fit.

