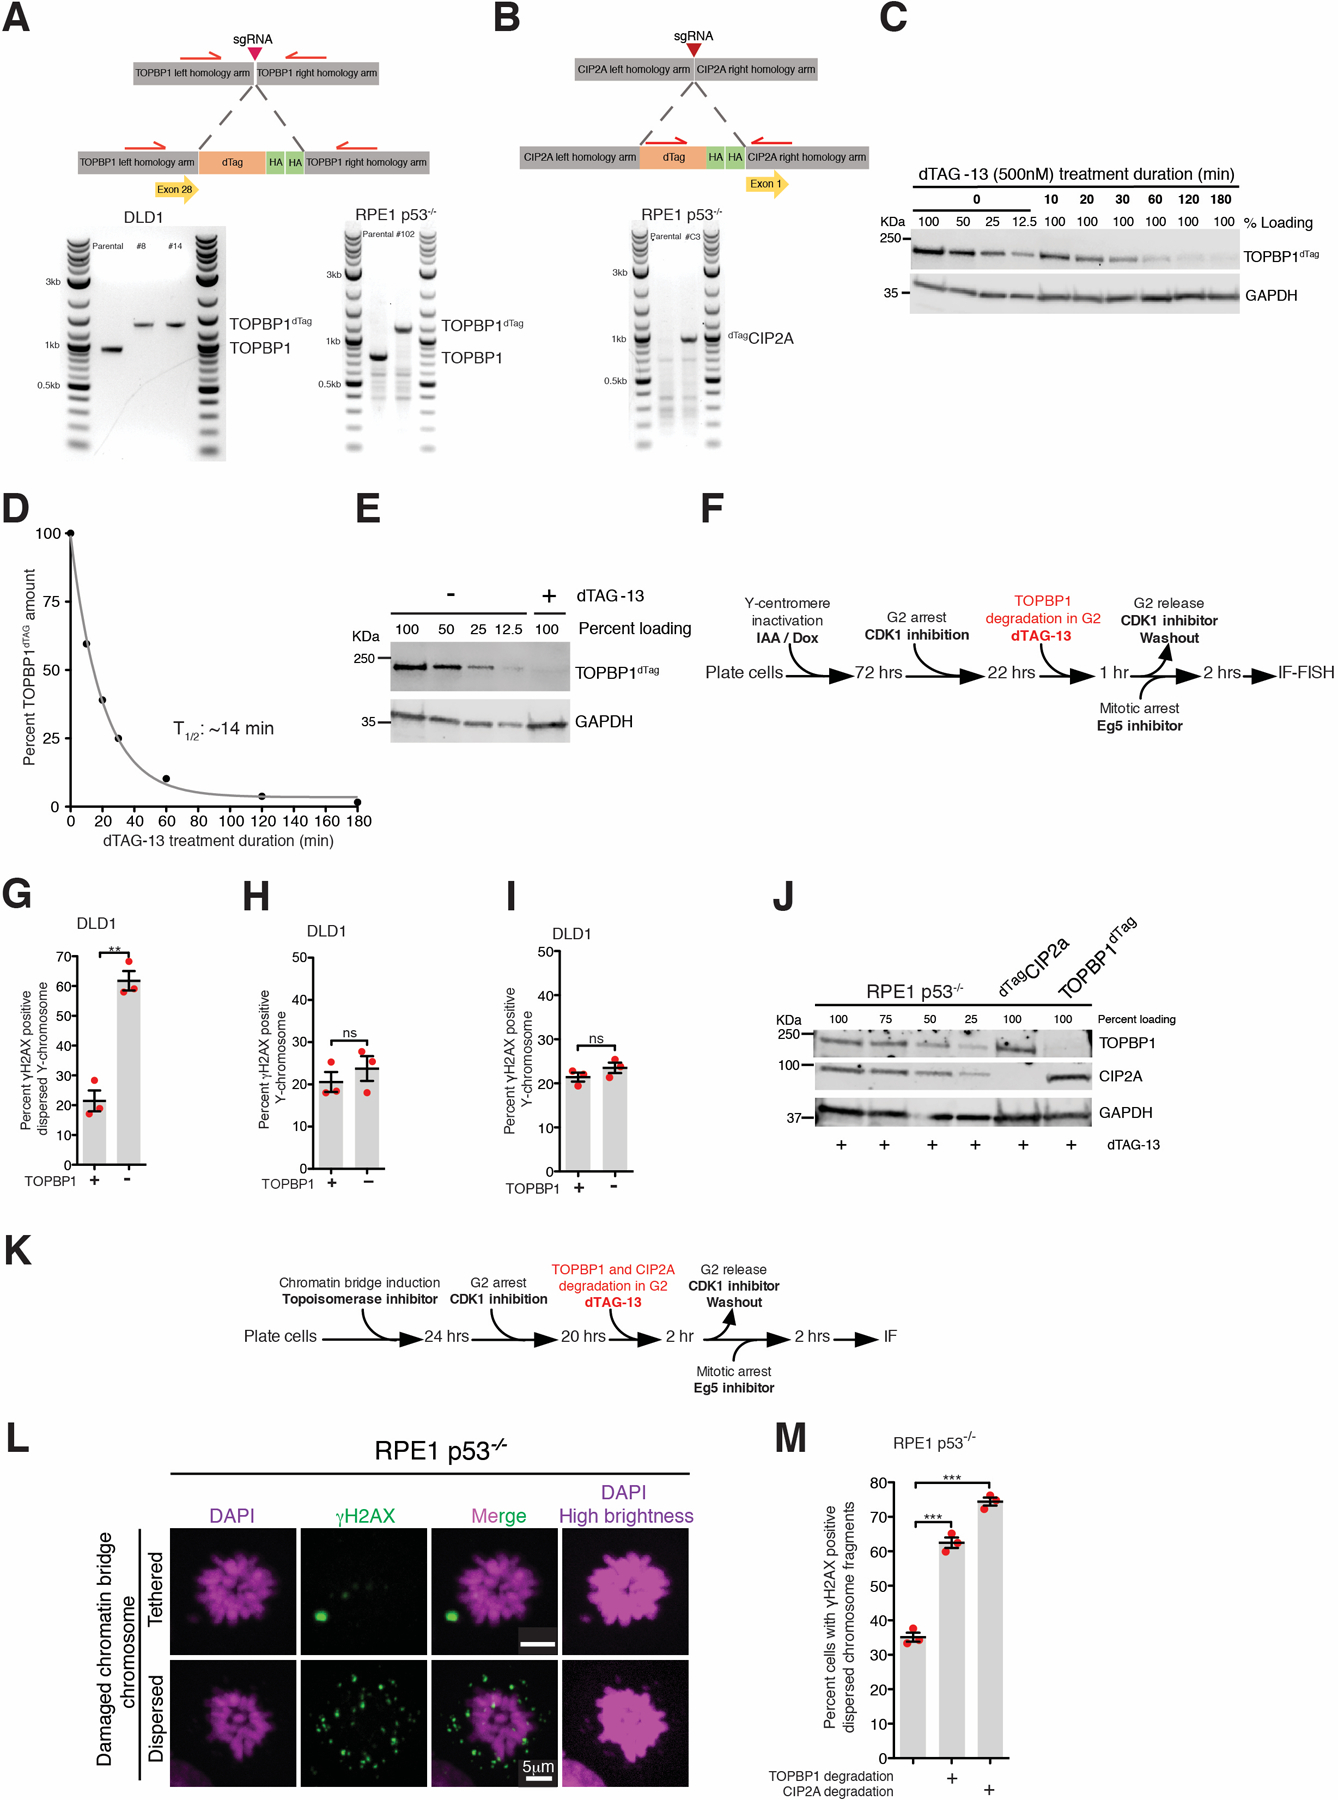
Extended Data Fig 8. Role of TOPBP1 and CIP2A in tethering fragments of damaged chromosome resulting from micronuclei or chromatin bridge during mitosis.

Schematic of (A) TOPBP1dTag and (B) dTagCIP2A tagging at genomic loci and an agarose gel image showing successful bi-allelic tagging. (C) Immunoblot showing dynamics of TOPBP1dTag degradation upon addition of dTAG-13 (for A, B, and C, the experiment was performed once). (D) Quantitation of TOPBP1dTag levels from (B). Data were fitted with single exponential decay curve, half-life 14 minutes. (E) Immunoblot showing depletion of TOPBP1dTag upon addition of dTAG-13 from the experiment outlined in Fig. 3D (two independent repeats were performed). (F) Experimental outline for (G) and (H). (G) Quantitation of cells with dispersed micronuclear Y-fragments in mitosis upon TOPBP1dTag degradation in G2. (H) Quantitation of cells with damaged Y-chromosome fragments (tethered or dispersed) in mitosis after degradation of TOPBP1dTag in G2 (for (G) and (H), n=3 independent experiments; total 693 and 672 cells were analyzed for control and TOPBP1dTag degradation conditions, respectively). (I) Quantitation of cells with damaged Y-fragments (tethered or dispersed) in mitosis upon degradation of TOPBP1dTag in mitosis for the experiment in Fig. 3D (the number of cells analyzed is the same as in Fig. 3E). For (G-I), mean +/− SEM are shown and two-tailed unpaired t-test was applied; *** P<0.0001 (for G P=0.0011) and ns P>0.05. (J) Immunoblot showing degradation of dTagCIP2A and TOPBP1dTag for the experiment outlined in Fig. 3F (immunoblot was performed for 2 of the 3 independent repeats). (for C, E, and J, uncropped blots in Supplementary Figure 1) (K) Experimental outline for (L) and (M). (L) Representative images of RPE p53−/− cells showing tethered and dispersed damaged micronuclear fragments in mitosis after induction of chromatin bridge by inhibition of Topoisomerase II. (M) Quantitation of cells with dispersed micronuclear fragments in mitosis following chromatin bridge induction upon degradation of TOPBP1dTag or dTagCIP2A (n=3 independent experiments; total 420, 518, and 396 cells were analyzed for control, TOPBP1dTag degradation, and dTagCIP2A degradation conditions, respectively). (Mean +/− SEM are shown and one-way analysis of variance with Bonferroni’s multiple comparison test was applied, *** P<0.0001.)
