
Extended Data Fig. 11. Asymmetric fragment segregation to daughter cells and fragment tethering requirement for cell viability after micronucleation.
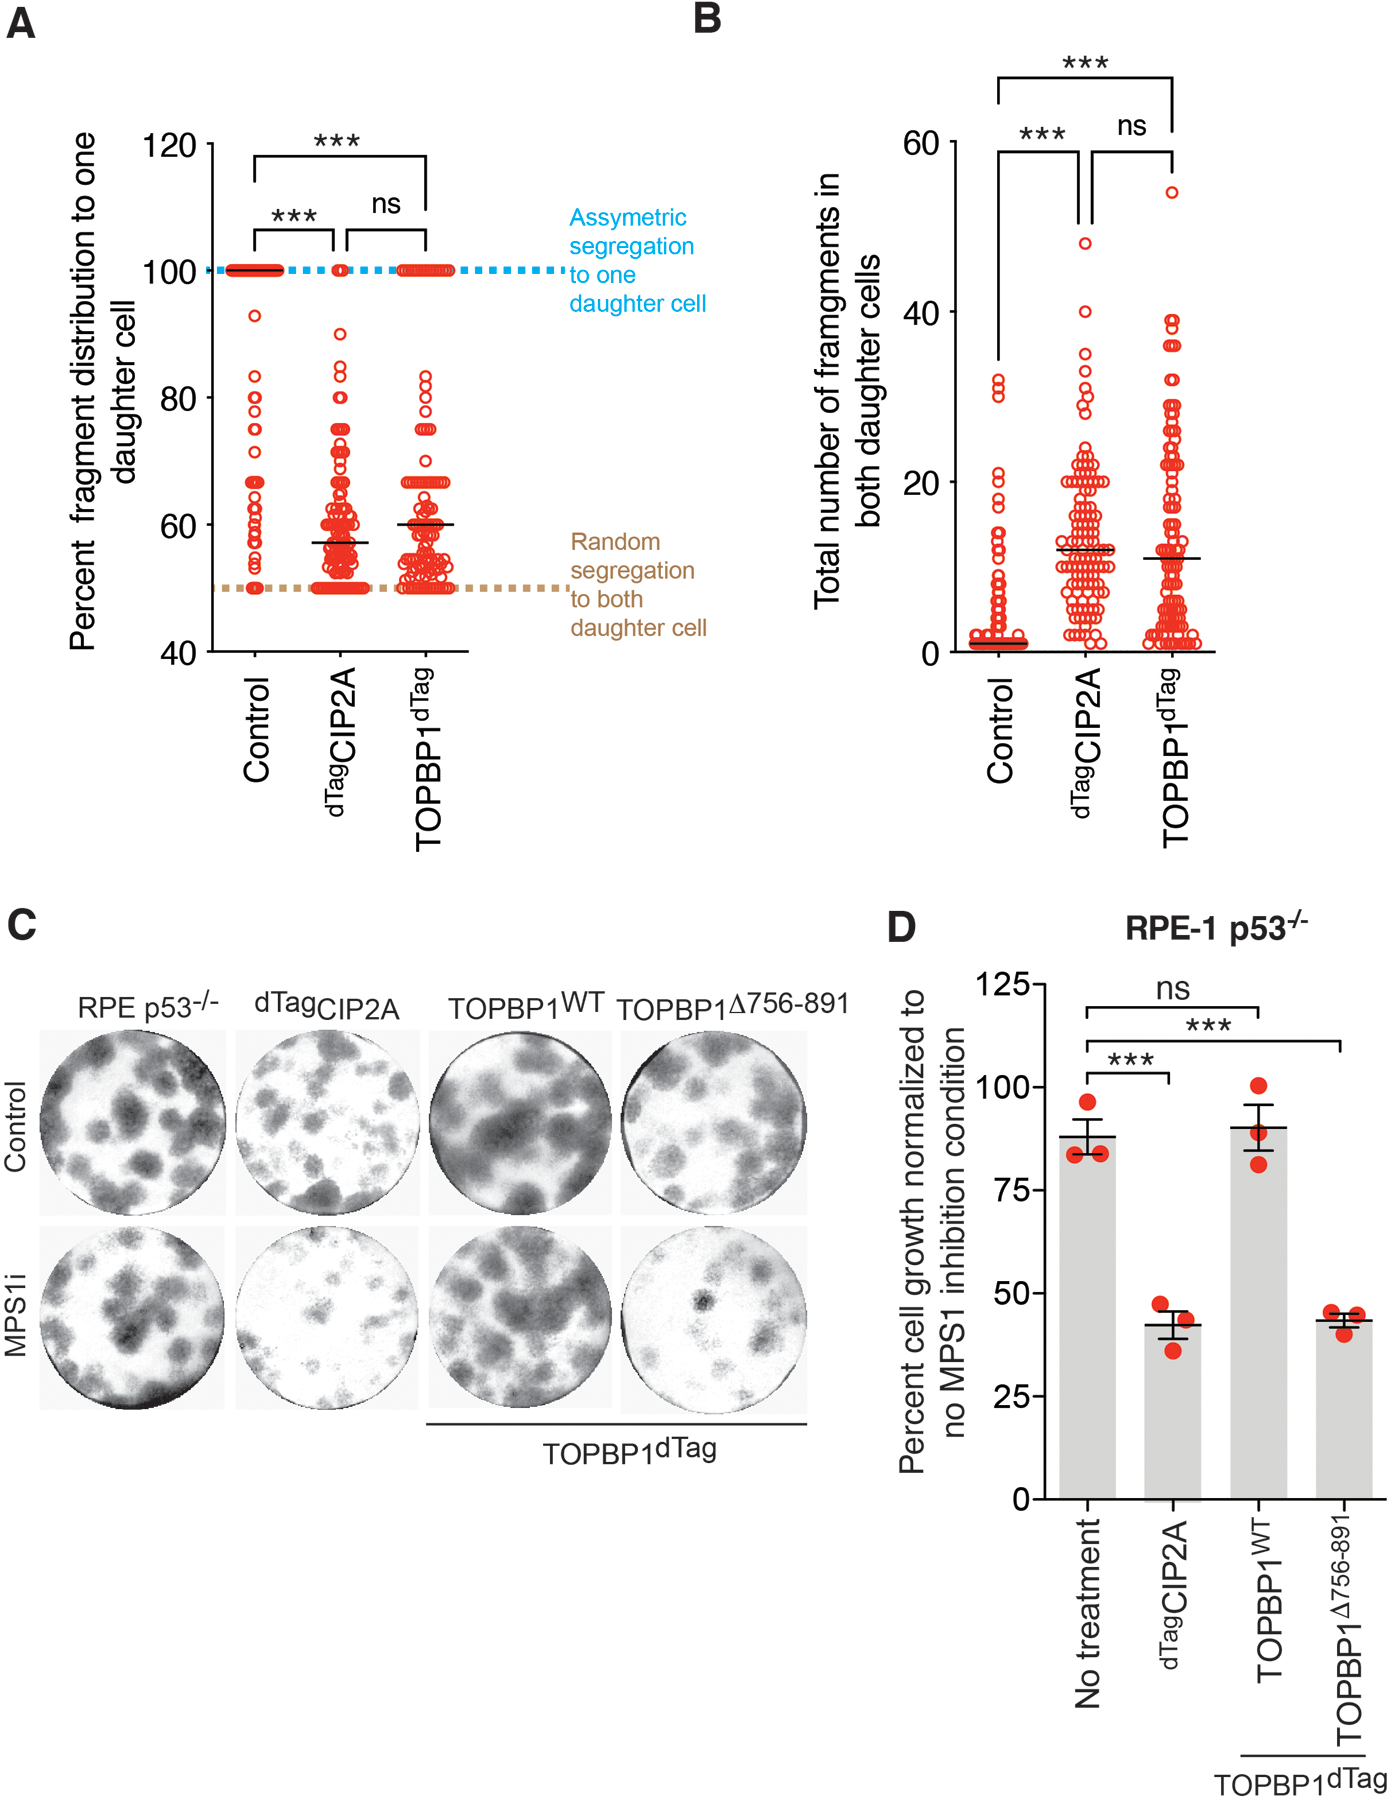
(A) Graph showing percent distribution of fragments between daughter cells in indicated condition from experiment shown in Fig. 4B–D. Percent distribution of fragments between daughter cells was calculated by dividing the number of fragments from the daughter that inherited the maximum number of fragments with the total number of fragments in both daughters and the resulting ratio was multiplied by 100. (B) Graph showing total number of fragments in both daughter cells for the indicated condition from experiment shown in Fig. 4B–D (for (A) and (B) n= 105, 107, and 107 daughter pairs for Control, dTagCIP2A, and TOPBP1dTag degradation condition, respectively were analyzed from one of the repeats of Fig. 4D). For A and B, Individual data points are shown in open red circles, median is shown as solid black line, and dashed black line shows 25th and 75th quartile. (C) Representative images of colony formed for indicated conditions. Same experimental setup as outlined in Fig.4E was used. (D) Quantitation of cell growth for the experiment in (C) (n=3 independent experiments), mean +/− SEM are shown. For (A), (B) and (D), One-way analysis of variance with Bonferroni’s multiple comparison test was applied, ns P>0.05, *** P<0.0001.