
Fig. 3. MDC1, TOPBP1, and CIP2A mediate clustering of micronuclear chromosome fragments during mitosis.
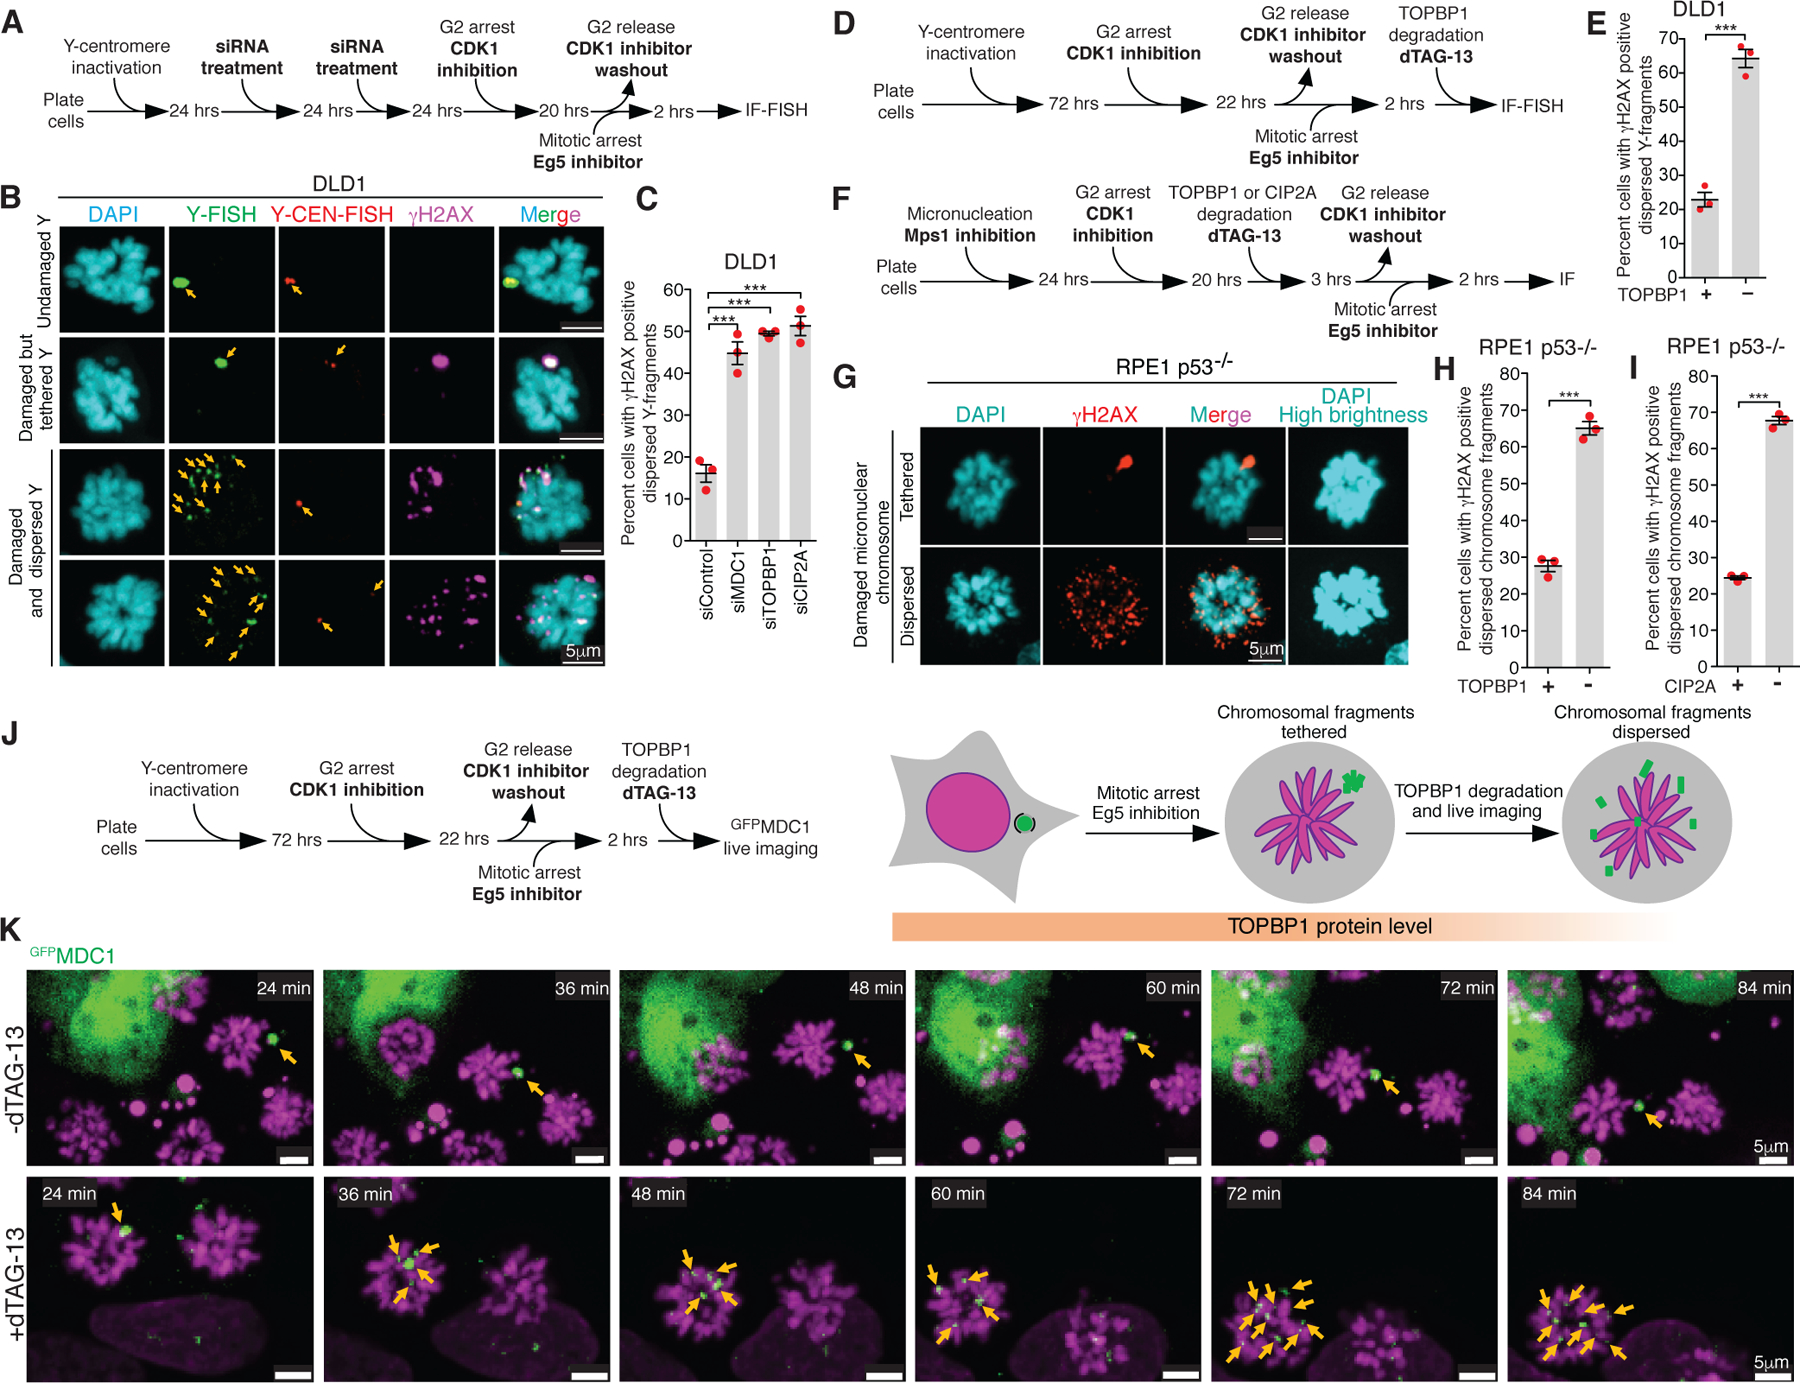
(A) Experimental outline for (B) and (C). (B) Representative images showing various fates of a micronucleated Y-chromosome in the subsequent mitosis. (C) Quantitation of cells with dispersed Y-chromosome fragments in mitosis upon siRNA mediated depletion of MDC1, TOPBP1, and CIP2A (n=3 independent experiments; a total of 770, 686, 662, and 667 cells were analyzed for control, siMDC1, siTOPBP1, and siCIP2A conditions, respectively). (One-way analysis of variance with Bonferroni’s multiple comparison test was applied, ***P<0.0001 and ns P>0.05.) (D) Schematic of experimental outline for (E). (E) Quantitation of cells with dispersed Y-chromosome fragments in mitosis upon degradation of TOPBP1dTag in mitosis (n=3 independent experiments; total 997 and 1131 cells were analyzed for control and TOPBP1dTag degradation condition, respectively). (F) Experimental outline for (G-I). (G) Representative images of RPE p53−/− cells showing tethered and dispersed damaged micronuclear fragments in mitosis after induction of micronucleation by Mps1 inhibition. Quantitation of cells with dispersed micronuclear fragments in mitosis upon degradation of (H) TOPBP1dTag (n=3 independent experiments; total 476 and 688 cells were analyzed for control and TOPBP1dTag degradation condition, respectively) or (I) dTagCIP2A (n=3 independent experiments; total 511 and 445 cells were analyzed for control and dTagCIP2A degradation conditions respectively). (J) Experimental outline and schematic for (K). (K) Frames of Sup. Video 7 and 8 showing behavior of GFPMDC1 labelled clustered damaged micronuclear chromosome in mitosis, when TOPBP1dTag degradation is induced (bottom) or not (top). Yellow arrows in (B) and (K) point to the fragments of micronuclear chromosomes. Two-tailed unpaired t-test was applied for data shown in (E) ***P=0.0003, (H) *** P<0.0001, and (I); *** P<0.0001. For graphs in (C), (E), (H) and (I), mean +/− SEM are shown, individual data points are shown as solid red circles.