
Fig. 5. Transient loss of CIP2A following micronucleation leads to increased deletions and inversions.
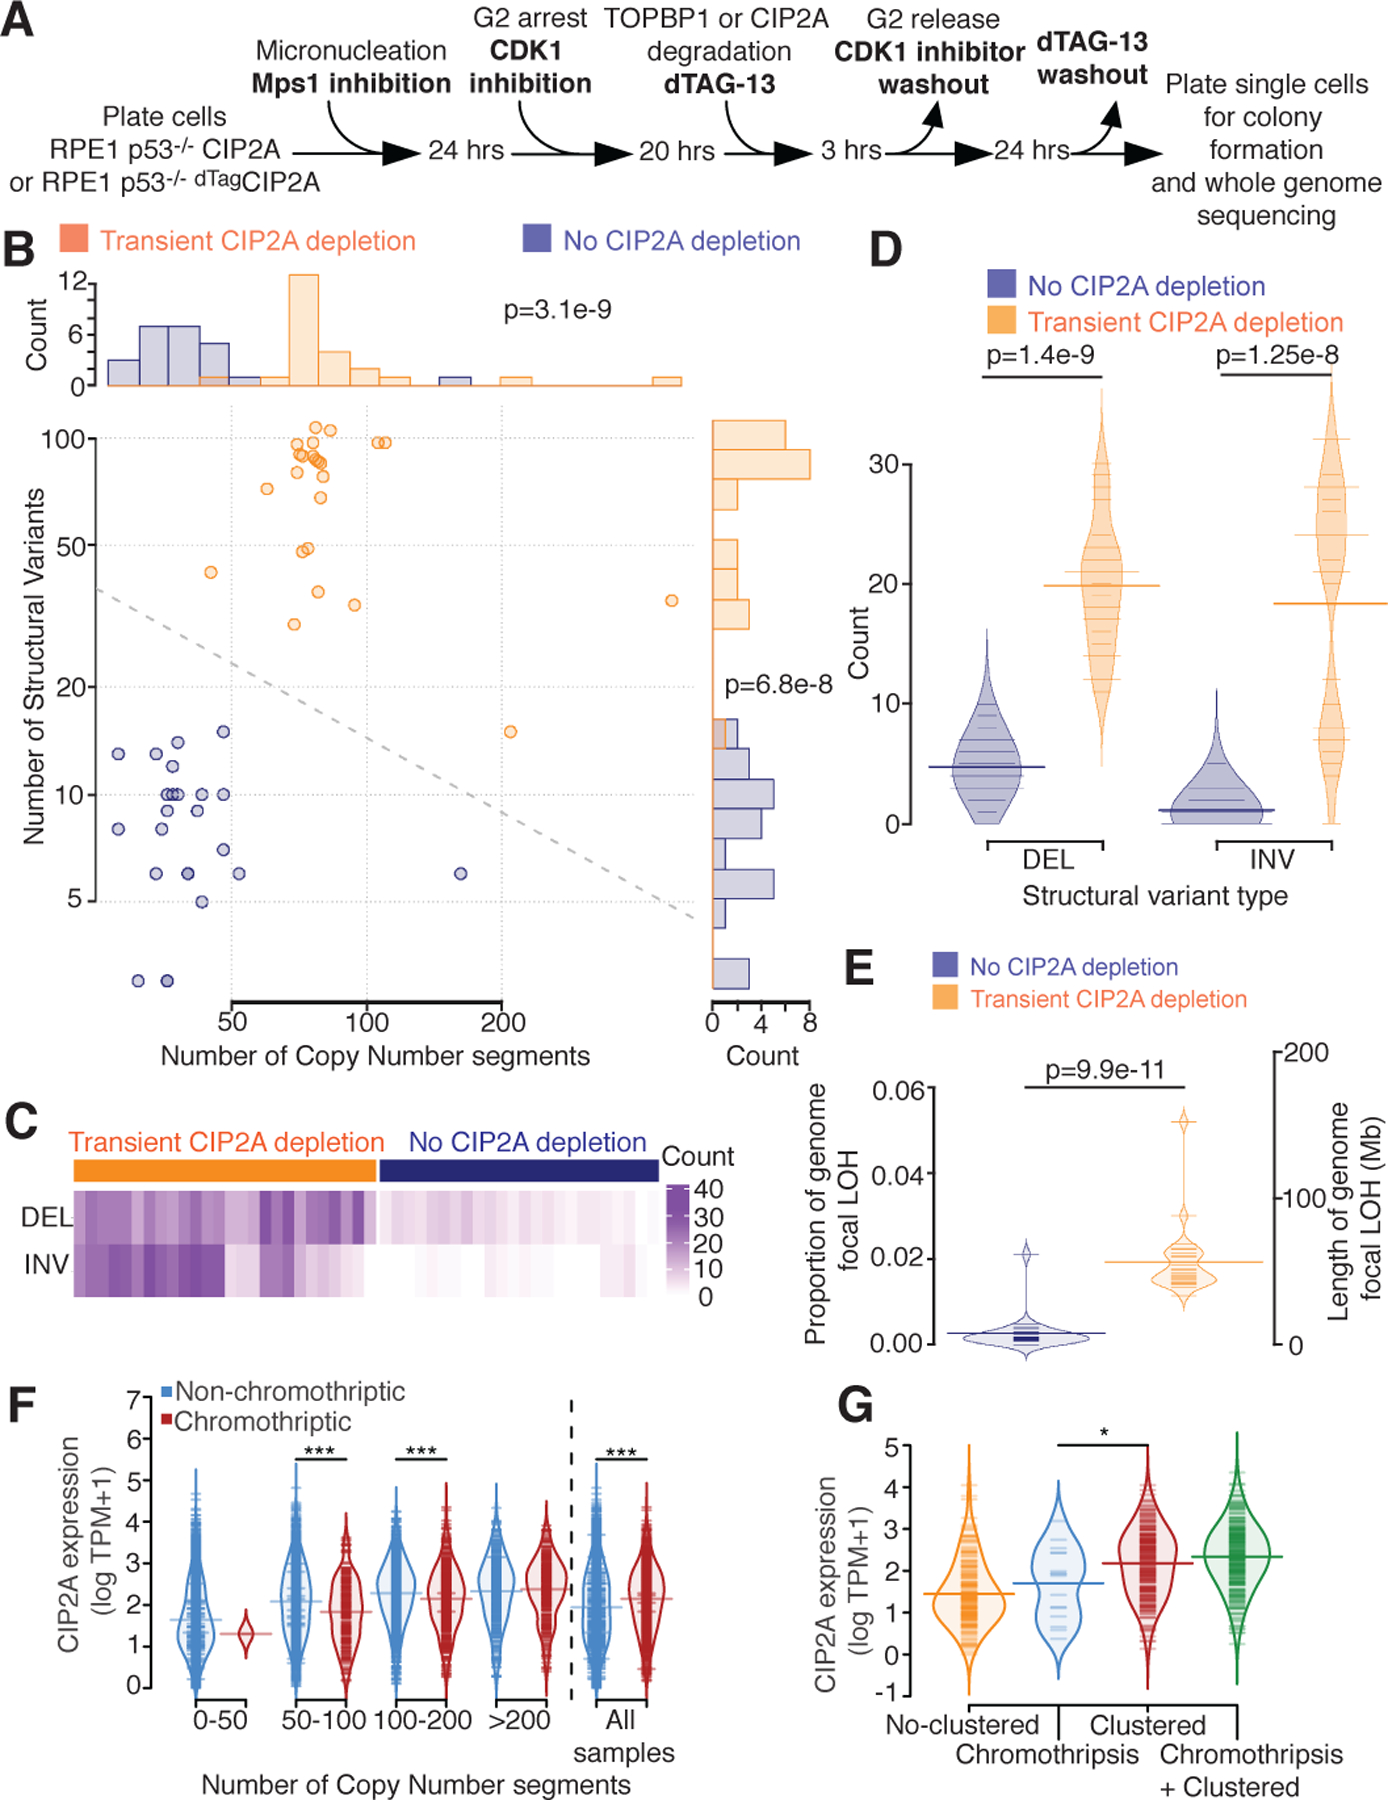
(A) Experimental outline for B-E. (B) Number of copy number segments (x-axis) and number of structural variants (y-axis) identified in 48 single cell clones with (orange, n=24) or without (blue, n=24) CIP2A depletion after micronucleation. Dotted line = decision boundary for a logistic regression predicting CIP2A condition from number of copy number segments and structural variants. Top panel: histogram of the number of copy number segments. Right panel: histogram of the number of structural variants. (C) Counts (purple) of deletions (DEL) and inversions (INV) split by CIP2A depleted (left, orange) or CIP2A unaltered (right, blue). (D) Number of deletion (DEL) or inversion (INV) identified (y-axis), split by CIP2A condition (color). (E) Proportion of the genome with focal loss of heterozygosity (LOH, <10 Megabase (Mb)) (left y-axis), or length of the genome LOH (right y-axis) in CIP2A unaltered (left, blue), or CIP2A depleted (right, orange) condition. Light colored distributions=density of proportions. For B, D, and E two-sided Mann-Whitney test was applied. (F) CIP2A gene expression (y-axis, log TPM+1) in cancer samples, stratified by copy number segmentation (x-axis) and chromothripsis status (CTLPscanner, color), or for all samples (right). ***=p<0.001, two-sided Mann-Whitney test. 50–100 p=9.7e-6. 100–200 p=7.4e-5. All samples p=1.4e-16. (G) CIP2A gene expression (y-axis) stratified by chromothripsis categories identified by ShatterSeek at a sample level (y-axis). No-clustered=no clustered event identified in the sample. Chromothripsis= only chromothriptic events identified. Clustered= only clustered events identified, may include ‘copy number neutral chromothripsis’. Chromothripsis + Clustered = both chromothriptic and clustered events found. *=p<0.05 (p=0.033), two-sided Mann-Whitney test. For F and G: log refers to natural log. For D, E, F and G: Light colored distributions=density of y-axis values. Thin colored lines=individual sample values. Thick colored lines=mean value.