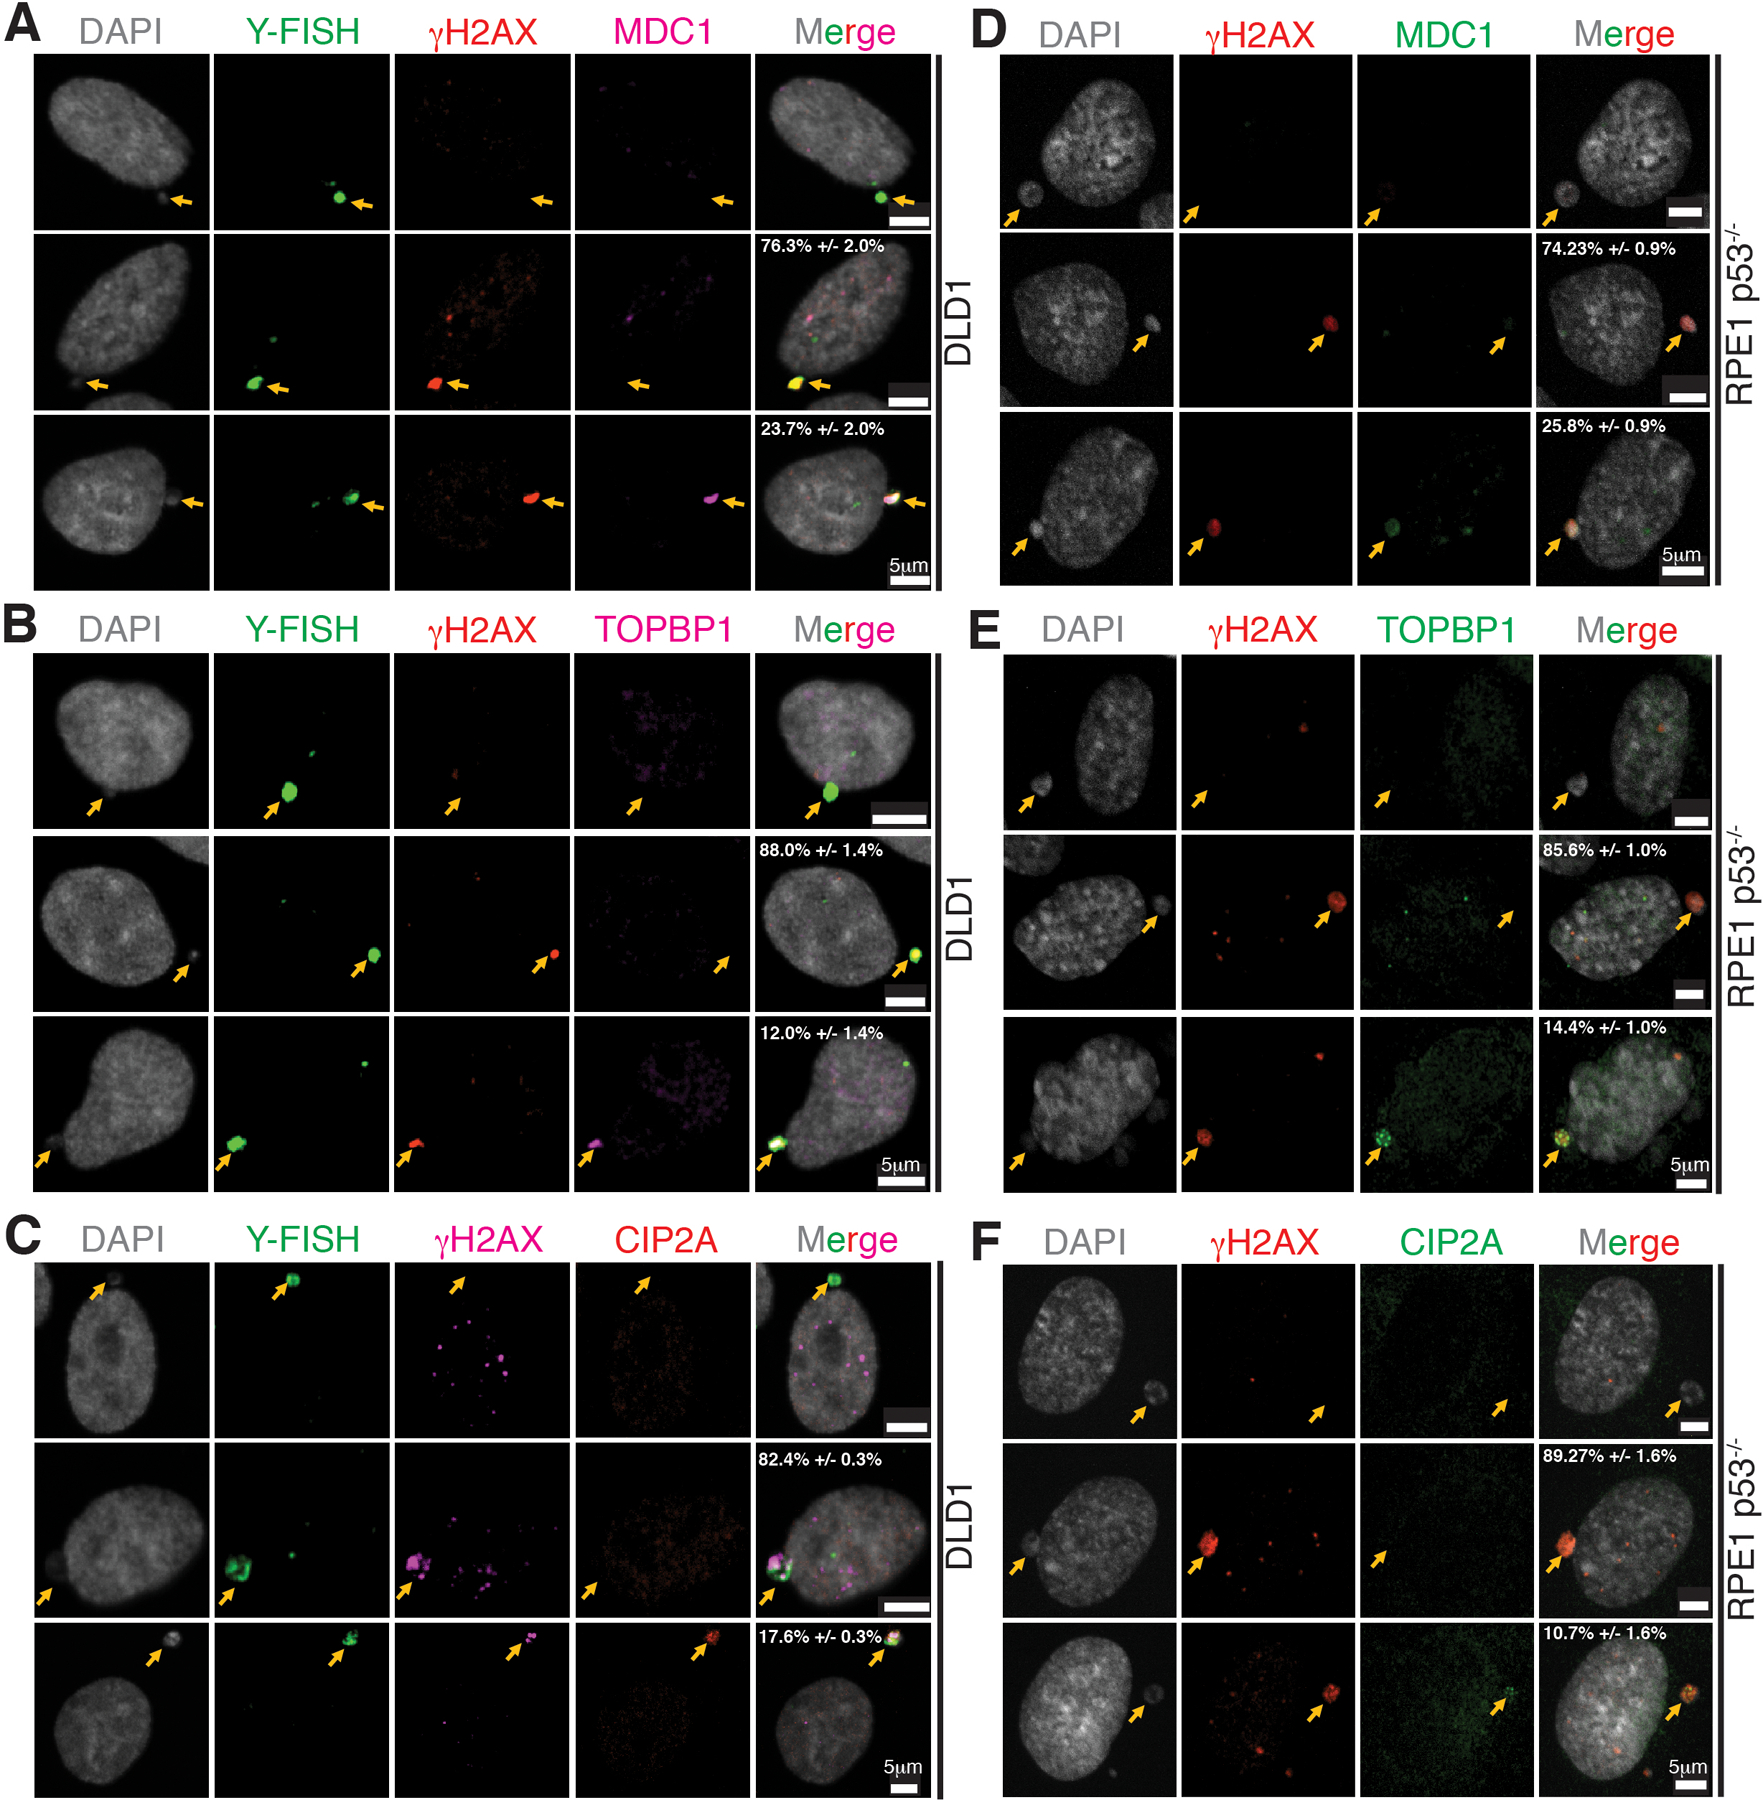
Extended Data Fig. 4. Localization of MDC1, TOPBP1, and CIP2A to micronuclei.

Representative images showing localization of (A, D) MDC1, (B, E) TOPBP1, and (C, F) CIP2A in micronuclei of DLD1 (n=3 independent experiments, total 482, 290, and 319 DLD1 cells were analyzed for MDC1, TOPBP1, and CIP2A, respectively) and RPE p53−/− (n=3 independent experiments, total 315, 360, and 299 RPE p53−/− cells were analyzed for MDC1, TOPBP1, and CIP2A, respectively) (percentage of cells (mean +/− SEM) with γH2AX positive micronuclei showing the phenotype in the images are indicated on the images). Yellow arrows point to the micronuclei.
