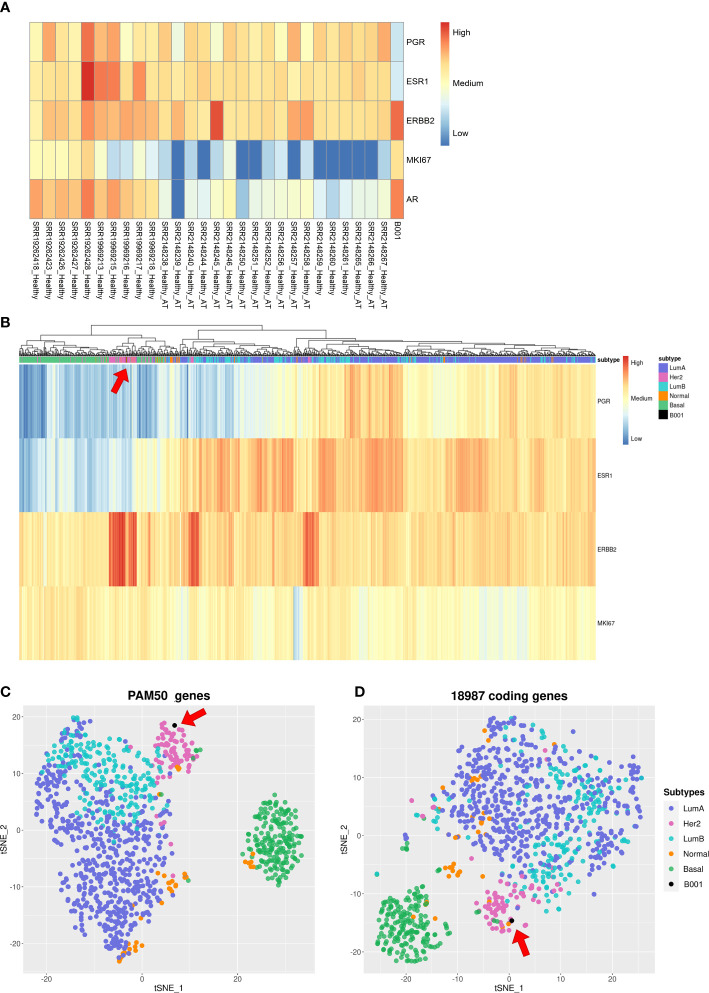
Figure 3.
Gene expression analysis of the tumor sample. (A) Hierarchical clustering heatmap with gene expression levels of PGR, ESR1, HER2, MKI67, and AR in breast cancer tissue from 28 healthy patients and from our tumor sample; (B) Hierarchical clustering heatmap showing gene expression levels of PGR, ESR1, HER2, and MKI67 of 1085 breast cancer patients in the TCGA dataset and our tumor sample; (C, D) T-SNE algorithm with 1085 breast cancer patients in the TCGA dataset and our tumor sample using PAM50 genes and 18987 coding genes, respectively.

