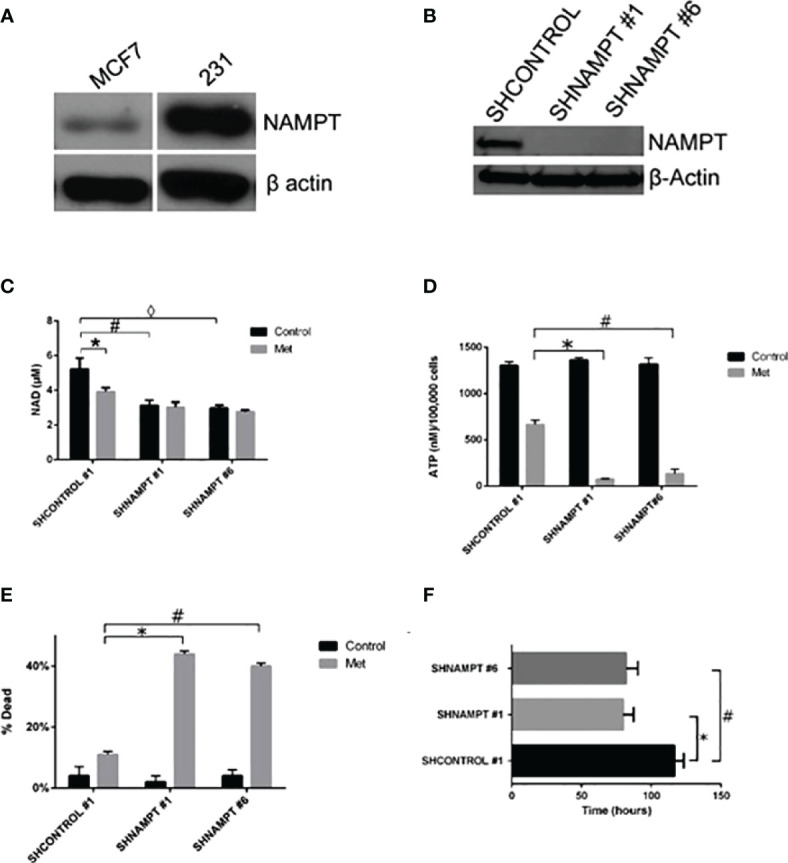
Figure 4.

231 cells overexpress NAMPT compared to MCF7 cells. When NAMPT is knocked down in 231 cells, NAD+ and ATP levels are depleted following metformin treatment, inducing metformin sensitivity. (A) Western blot showing that metformin-resistant 231 cells have higher levels of NAMPT compared to metformin-sensitive MCF7 cells. (B) Western blot showing 231 stable cells expressing shNAMPT have low NAMPT expression. (C) NAMPT knockdown leads to lower NAD+ levels after 1 day of treatment with 8 mM metformin (*p = 0.029, #p = 0.0069, ◊p = 0.004). (D) ATP depletion was also seen with the same treatments (*p = 0.000029, #p = 0.00018). (E) Enhanced cell death in shNAMPT stables following metformin treatment shown in a Trypan Blue exclusion assay (*p = 0.0000024, #p = 0.0000037). (F) Depiction of the time that the cell index reached less than 1 after 8 mM metformin treatment (*p = 0.0003, #p = 0.0008).
