
Figure 1.
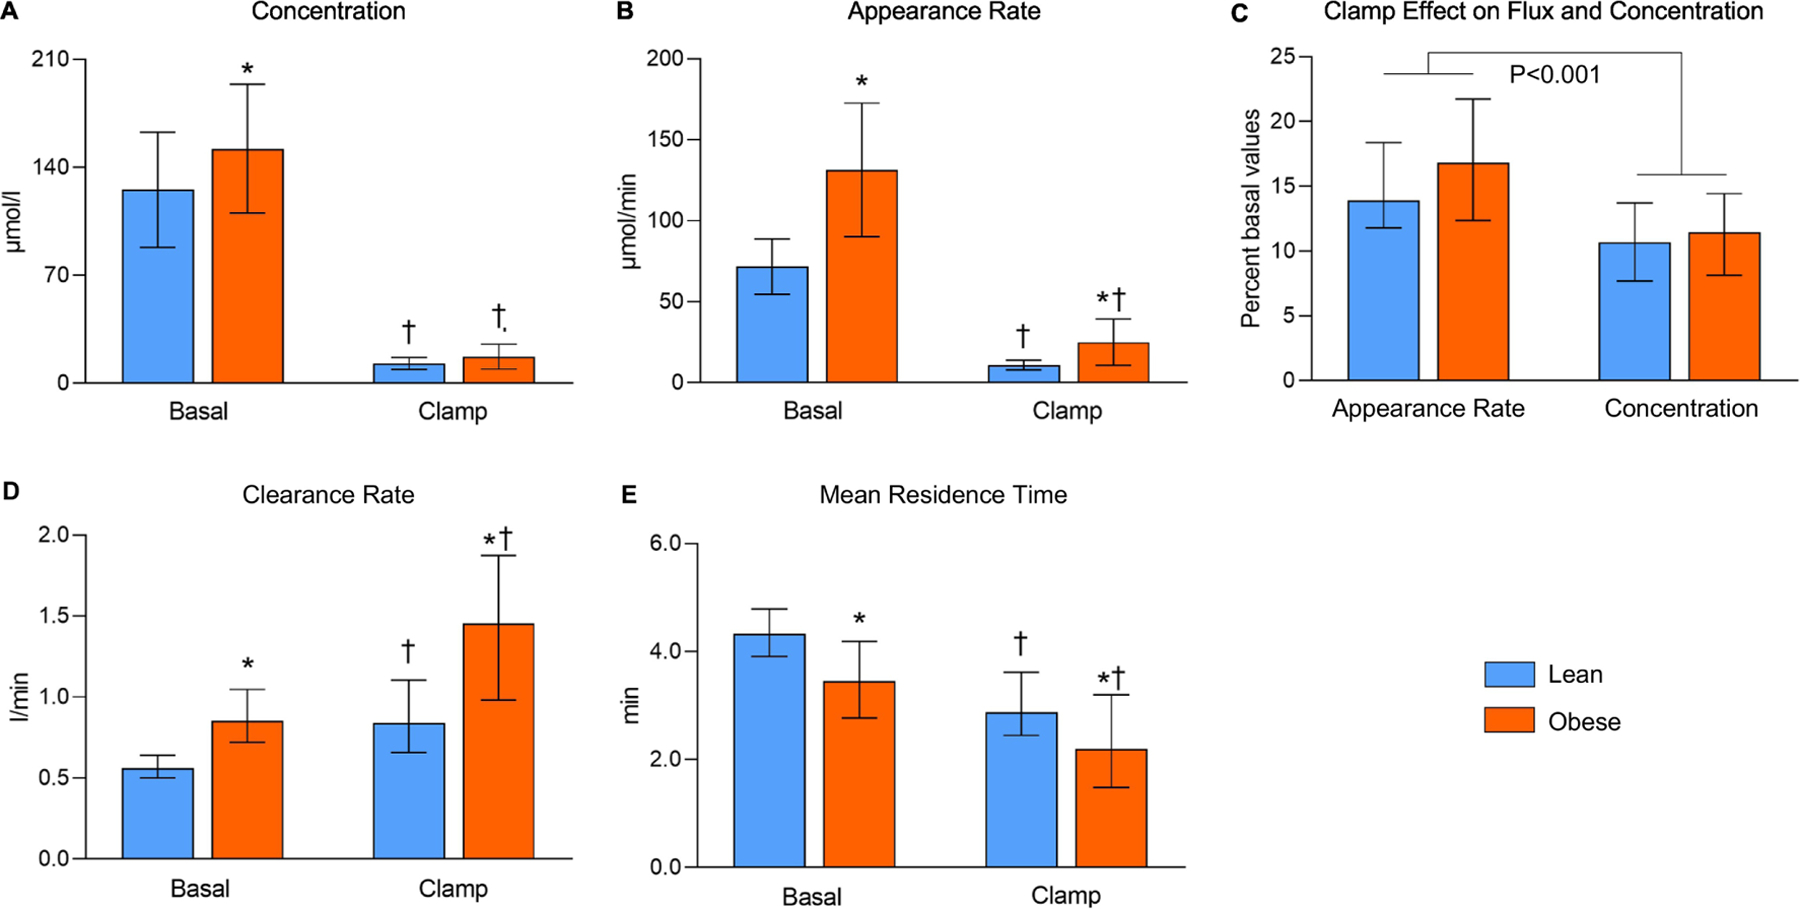
Palmitate concentration in plasma (A), appearance rate in plasma (B), plasma clearance rate (D), and mean residence time in the circulation (E) during basal conditions and during the hyperinsulinemic-euglycemic clamp procedure, and clamp-induced changes in palmitate appearance rate and plasma concentration (C). Values are median and interquartile range. For the outcomes in panels A, B, D, and E, there was a significant group (lean vs obese) × condition (basal vs clamp) interaction, P < 0.001. * Significantly different from the corresponding value in the lean group, P < 0.05. † Significantly different from the corresponding basal value, P < 0.05.