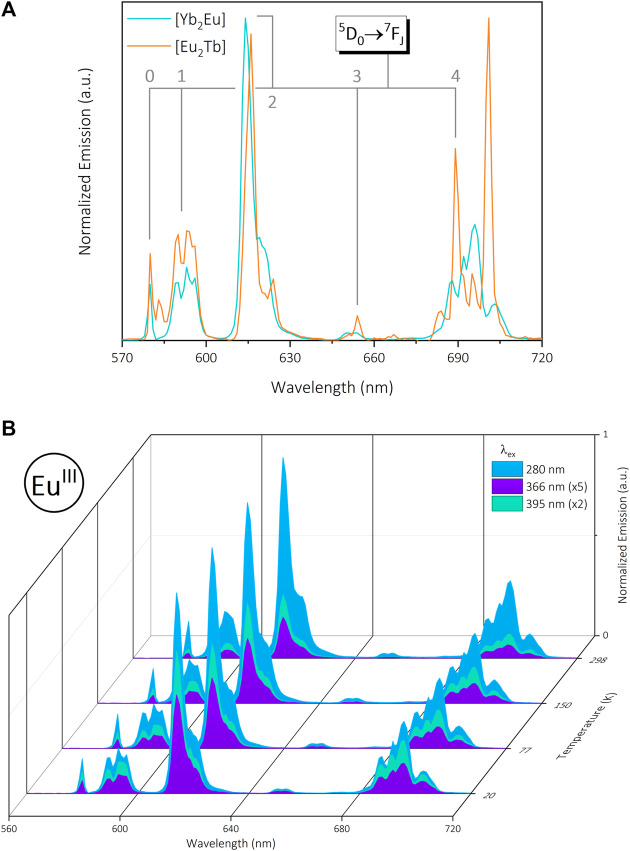
FIGURE 4.
(A): Normalized visible emission of trinuclear bimetallic [Yb2Eu] (green) and [Eu2Tb] (orange) under 280 nm excitation in the solid state at 20 K. Data are normalized for each complex relative to the emission maximum. (B): Normalized visible emission from [Yb2Eu] at 20—298 K under 280 nm (blue), 366 nm (purple) and 395 nm (green) excitation in the solid state (normalized to ∼615 nm @ λex = 280 nm).

