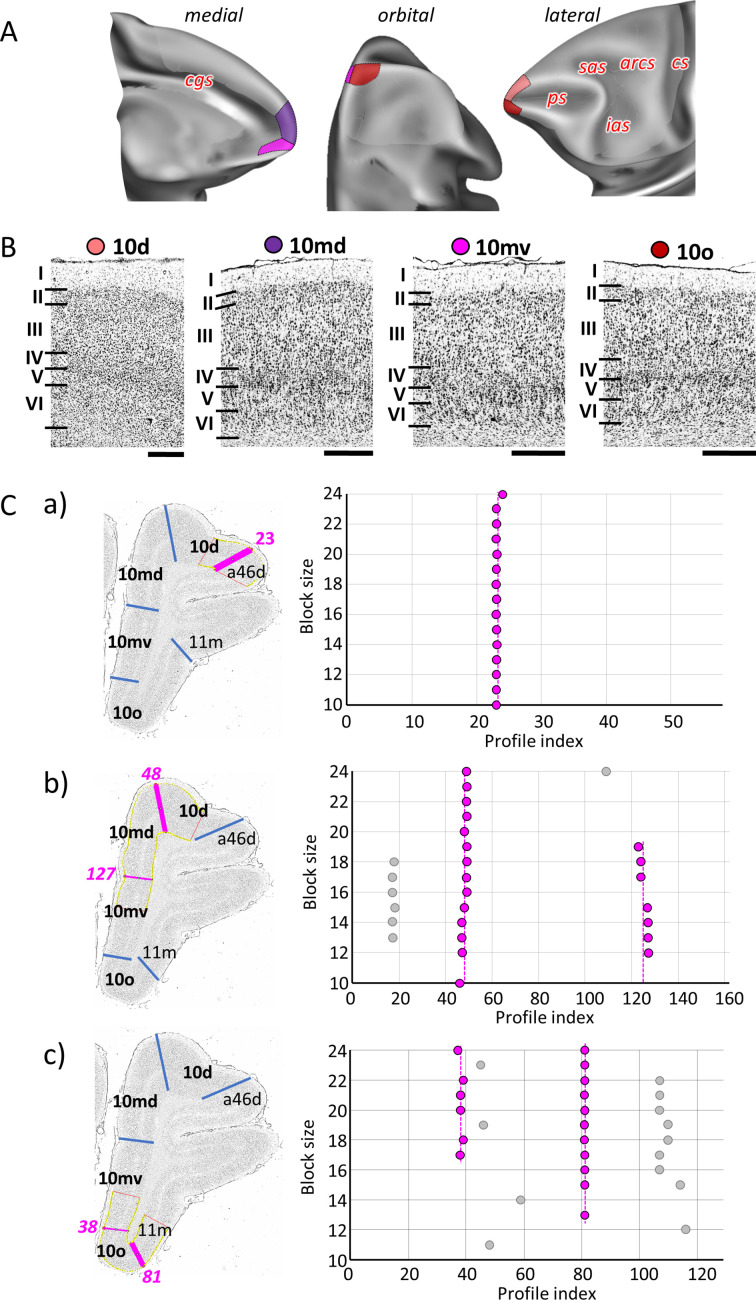
Figure 3. Quantitative analysis of the cytoarchitecture of Walker’s area 10 (Walker, 1940).
(A) Position and extent of subdivisions of Walker’s area 10 within the hemisphere are displayed on orbital, lateral, and medial views of the Yerkes19. Macroanatomical landmarks are marked in red letters. (B) High-resolution photomicrographs show cytoarchitectonic features of areas 10d, 10md, 10mv, and 10o. Each subdivision is labelled by a coloured dot, matching the colour of the depicted area on the 3D model. (C) We confirmed cytoarchitectonic borders by a statistically testable method, where the Mahalanobis distance (MD) was used to quantify differences in the shape of profiles extracted from the region of interest. Profiles were extracted between outer and inner contour lines (yellow lines drawn between layers I/II and VI/white matter, respectively) defined on grey-level index (GLI) images of the histological sections (left column). Pink lines highlight the position of the border for which statistical significance was tested. The dot plots (right column) reveal that the location of the significant border remains constant over a large block size interval (highlighted by the red dots). (a) depicts analysis of the border between areas 10d and a46d (profile index 23); (b) depicts analysis of the border delineating dorsally located subdivisions, 10d and10md (profile index 48), as well as the medial border segregating dorsal and ventral subdivision, 10md and 10mv (profile index 127); and (c) depicts analysis of the borders between ventrally positioned subdivisions of the frontal polar region, 10mv and 10o (profile index 38) and 10o and 11m (profile index 81). Scale bar 1 mm. Roman numerals indicate cytoarchitectonic layers. arcs, spur of the arcuate sulcus; cgs, cingulate sulcus; cs, central sulcus; ias, inferior arcuate sulcus; ps, principal sulcus; sas, superior arcuate sulcus.

