. 2023 Aug 14;12:e82850. doi: 10.7554/eLife.82850

Figure 4. Cytoarchitecture of orbitofrontal areas.

(A) Position and extent of the orbitofrontal areas within the hemisphere are displayed on orbital, lateral, and medial views of the Yerkes19. Macroanatomical landmarks are marked in red letters. (B) High-resolution photomicrographs show cytoarchitectonic features of orbitofrontal 14r, 14c, 11m, 11l, 12r, 12m, 12l, 12o, 13b, 13a, 13m, and 13l. Each subdivision is labelled by a coloured dot, matching the colour of the depict area on the 3D model. Scale bar 1 mm. Roman numerals (and letters) indicate cytoarchitectonic layers. arcs, spur of the arcuate sulcus; cgs, cingulate sulcus; cs, central sulcus; ias, inferior arcuate sulcus; ps, principal sulcus; sas, superior arcuate sulcus.

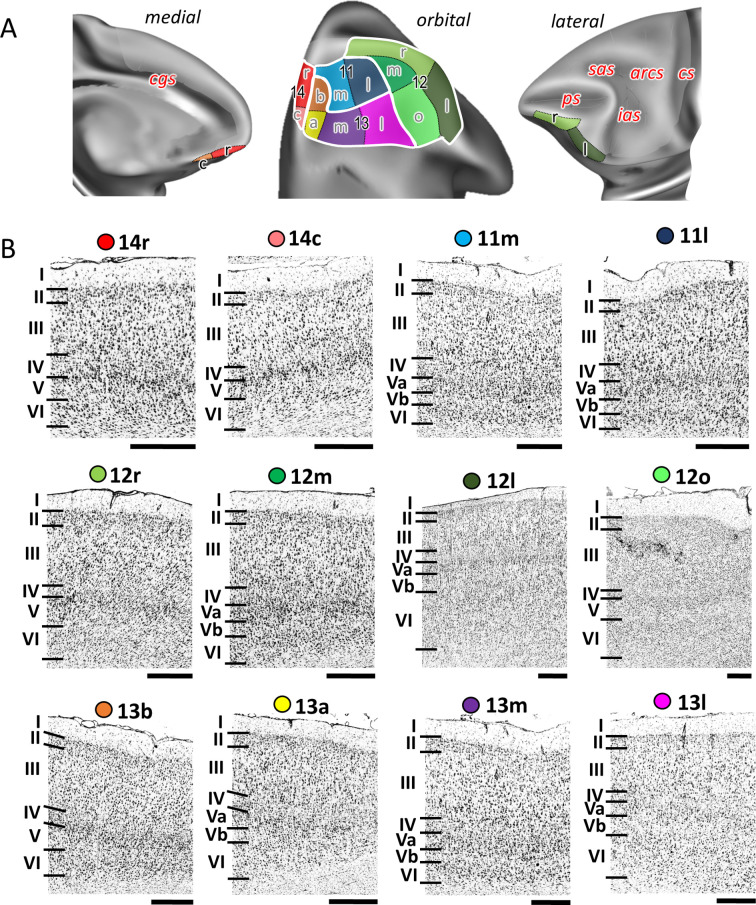
Figure 4.

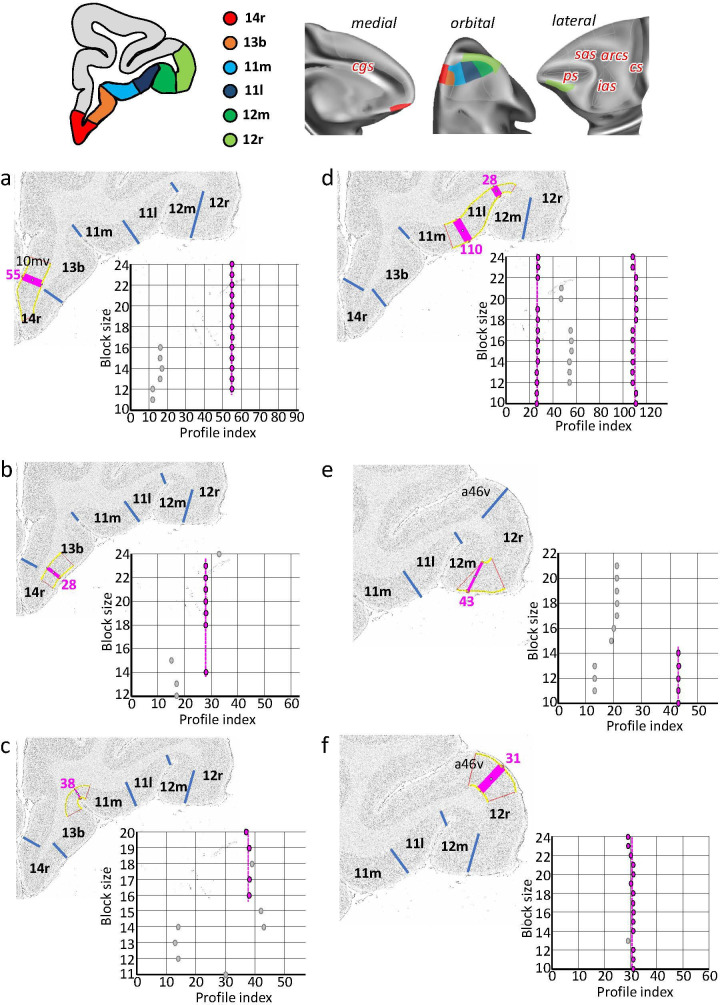
Figure 4—figure supplement 1. Statistically testable borders (pink lines) confirmed by the quantitative analysis for the rostral orbital and ventrolateral areas 14r, 13b, 11m, 11l, 12m, and 12r.

Figure 4—figure supplement 1.

(a) Border between 14r and 10mv (profile index 55); (b) border between 14a and 13b (profile index 28); (c) border between 13b and 11m (profile index 38); (d) borders between 11m and 11l (profile index 110) and 11l and 12m (profile index 28); (e) border between 12m and 12r (profile index 43); and (f) border between 124 and a46v (profile index 31). For details see Figure 3.
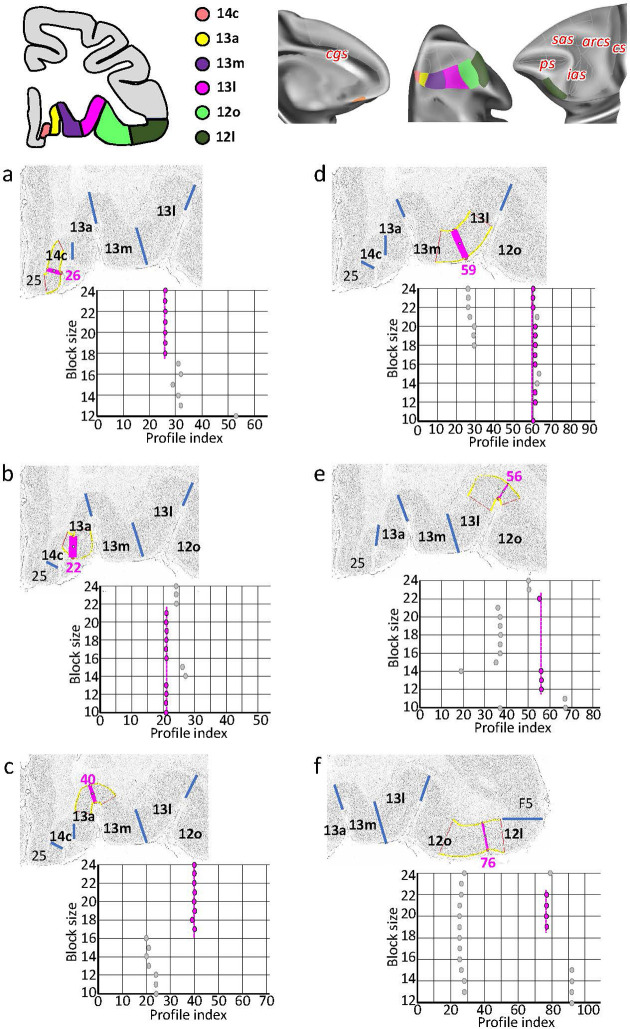
Figure 4—figure supplement 2. Statistically testable borders (pink lines) confirmed by the quantitative analysis for the caudal orbital and ventrolateral areas 14c, 13a, 13m, 13l, and 12o.

Figure 4—figure supplement 2.

(a) Border between 25 and 14c (profile index 26); (b) border between 14c and 13a (profile index 22); (c) border between 13a and 13m (profile index 40); (d) border between 13m and 13l (profile index 59); (e) border between 13l and 12o (profile index 56); and (f) border between 12o and 12l (profile index 76). For details see Figure 3.