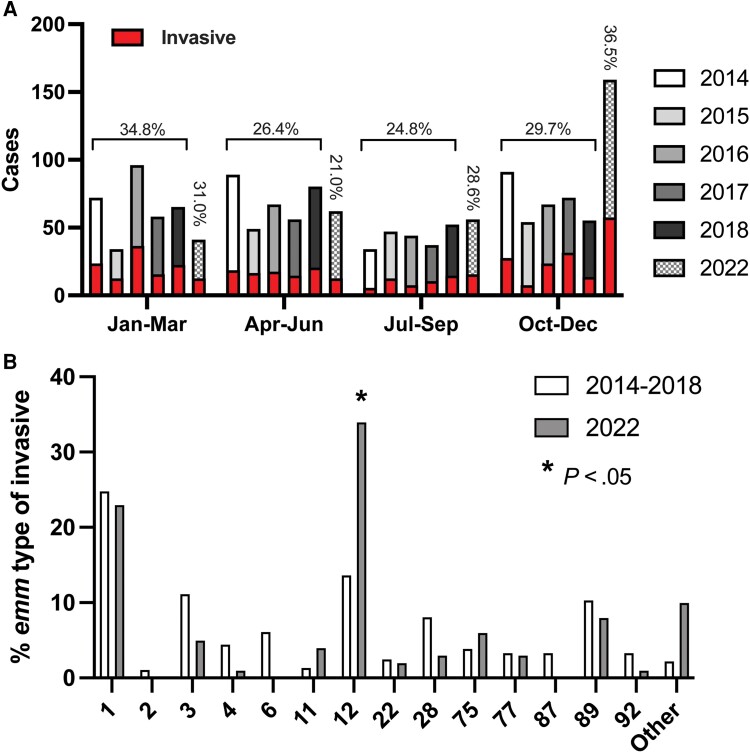
Figure 1.
Comparison of pediatric group A streptococcal (GAS) infections in prepandemic and pandemic periods. A, Total pediatric GAS cases by 3-month period (quarter) in prepandemic (2014–2018) and pandemic (2022) years. Vertical bars represent total cases for the given year with red insets indicating total invasive GAS cases. Percentages for invasive GAS in the 2014–2018 period by quarter are given along with percentage of invasive GAS cases in 2022. B, Frequency of GAS emm types among invasive pediatric infections for prepandemic (2014–2018) and pandemic (2022) years. Only those emm types with >10 observations (combined) are shown. P value was determined by χ2 test following Bonferroni correction. Complete emm type data are provided in Supplementary Table 2.

