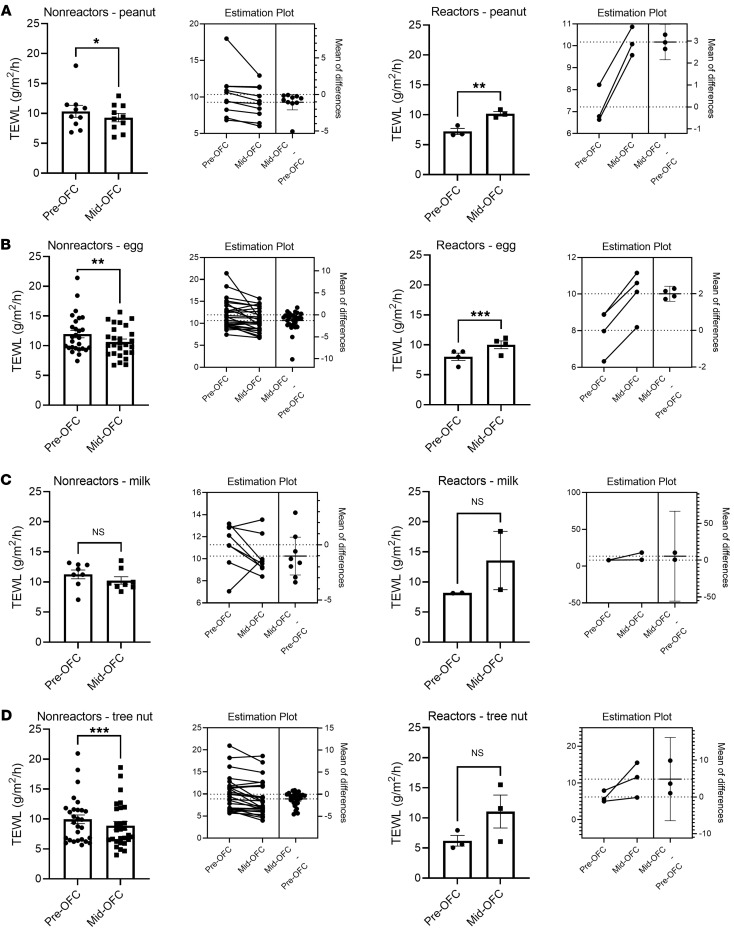
Figure 3. Change in sTEWL results by food type.
Each panel shows the change in TEWL from baseline to either food dose 2 or 3 for nonreactors or prior to epinephrine or other treatment for reactors, with each panel delineated by food type. Estimation plots for pairwise P values for each group are shown. (A) Peanut OFCs (nonreactors, n = 10; reactors, n = 3). (B) Egg OFCs, which included both baked and cooked egg challenges (nonreactors, n = 27; reactors, n = 4). (C) Milk OFCs, which included both baked and unbaked milk OFCs (nonreactors, n = 8; reactors, n = 2). (D) Tree nut OFCs, which included all tree nut OFCs in the study (nonreactors, n = 28; reactors, n = 3). Paired t tests were used to compare means for 2-variable plots. *P < 0.05, **P < 0.01, and ***P < 0.001.

