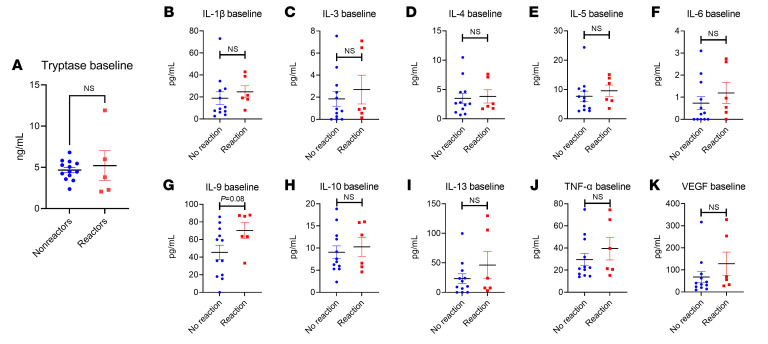
Figure 4. Baseline systemic immune markers.
Baseline plasma results for (A) tryptase (n = 20), (B) IL-1β, (C) IL-3, (D) IL-4, (E) IL-5, (F) IL-6, (G) IL-9, (H) IL-10, (I) IL-13, (J) TNF-α, and (K) VEGF (n = 18 for B–K). All results are shown by reaction status. Simple t tests were used to compare 2-variable plots with normally-distributed data (tryptase, IL-1β, IL-5, IL-9), and Kruskal-Wallis tests were used to compare non-normally-distributed data (IL-3, IL-4, IL-6, IL-10, IL-13, TNF-α). Normality testing results are shown in Supplemental Table 1.

