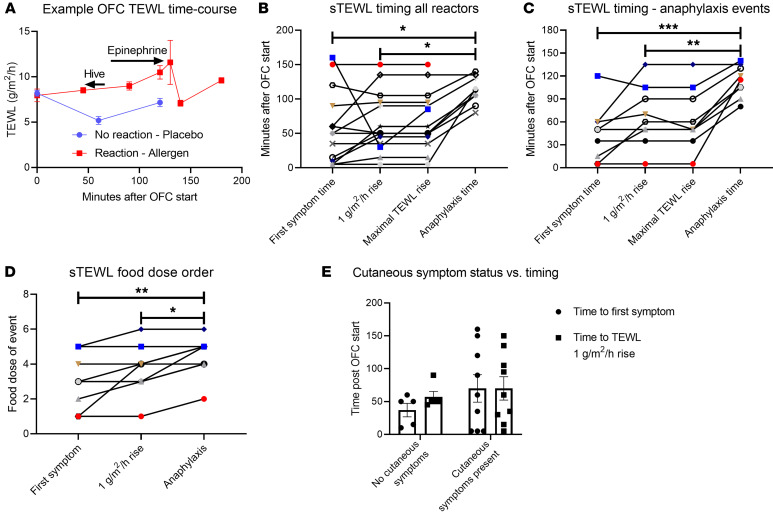
Figure 6. Timing of TEWL changes in relation to clinical events.
(A) Representative time course of TEWL results for a reactive OFC (red) that led to anaphylaxis and a nonreactive challenge (blue). (B and C) Time to first symptom, to a 1 g/m2/h rise in TEWL, to the maximal TEWL rise, and to anaphylaxis (if it occurred) during OFCs resulting in (B) any reaction (n = 14) or (C) anaphylaxis that required epinephrine administration (n = 9). (D) Food dose of first symptom, of a 1 g/m2/h rise in TEWL, and of epinephrine administration during OFCs resulting in anaphylaxis and requiring epinephrine administration (n = 9). (E) Time to first symptom and to a 1-unit TEWL rise among reactors with cutaneous symptoms at any point (n = 5) or no cutaneous symptoms at any point (n = 9). Simple t tests were used to compare 2-variable plots, and ANOVA was used to compare means for plots showing 3 or more variables. *P < 0.05, **P < 0.01, and ***P < 0.001.

