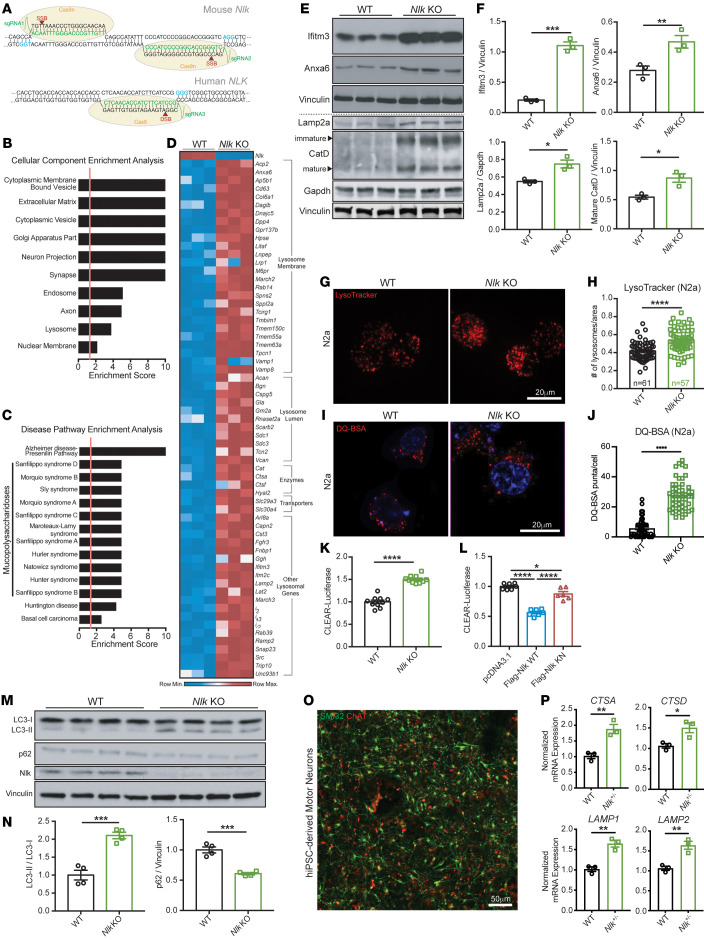
Figure 1. Reduction of Nlk increases lysosome biogenesis in vitro.
(A) Schematic of dual-guide RNA targeting of Cas9 nickase (Cas9n) to Nlk for generation of isogenic Nlk KON 2a cells and NLK+/- hiPSCs. (B and C) Enrichment analyses for all significantly differentially expressed genes from RNA-Seq of isogenic WT and Nlk KO N2a cells. Significant enrichment scores of 1.3 (FDR adjusted P value q < 0.05) are designated by vertical red lines. (D) Heatmap of significantly upregulated lysosomal genes from RNA-Seq (n = 3 biological replicates). (E and F) Western blot validation (E) confirmed RNA-Seq results, quantified in F (n = 3 biological replicates). Blot lanes separated by the dotted line were run on lysates from distinct experimental replicates and normalized to their respective housekeeping proteins. (G and H) Representative LysoTracker images of N2a cells (G), quantified in H, demonstrated increased lysosome number in Nlk KO cells (WT, n = 61 cells; Nlk KO, n = 57 cells). (I and J) Representative images of functional lysosomes in N2a cells incubated with DQ BSA (I), quantified in J (WT, n = 50 cells; Nlk KO, n = 50 cells). (K and L) CLEAR-luciferase assay in Nlk KO N2a cells (K) or WT N2a cells transfected with WT or KN Nlk (L) demonstrated Nlk kinase activity suppresses CLEAR network transcription (K, n = 10 replicates from 2 different Nlk KO clones; L, n = 7 replicates from 2 experimental repeats). (M and N) Western blots (M) showed increased LC3-II/LC3-I and decreased p62 levels in Nlk KO N2a cells, quantified in N (n = 4 biological replicates). (O) Representative immunostaining images of hiPSC-derived motor neurons. (P) qPCR showing NLK+/– iPSC–derived motor neurons expressed higher levels of CTSA, CTSD, LAMP1, and LAMP2 compared with isogenic controls (n = 3 biological replicates from distinct motor neuron differentiations). Two-tailed t tests (F, H, J, K, N, and P) or 1-way ANOVA (L) analyses were performed, and data are represented as mean ± SEM. *P < 0.05; **P < 0.01; ***P < 0.001; ****P < 0.0001.

