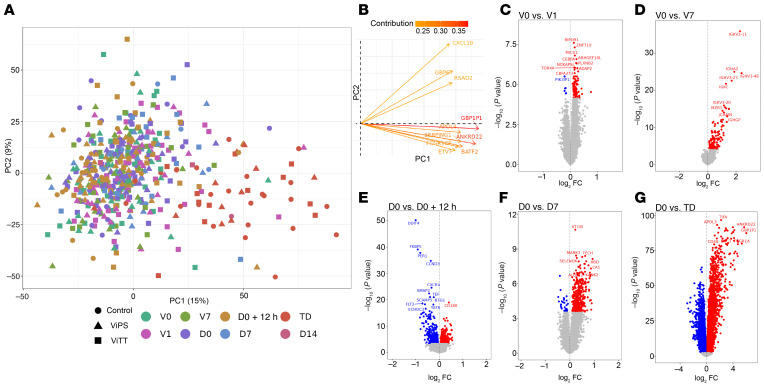
Figure 2. Global overview of blood gene expression data over the study time points.
(A) PC analysis plot and contribution plot of RNA-Seq data (13,609 genes, n = 514) from all study time points, batch corrected for the sequencing pool. (B) Contribution plot of the genes contributing to PC1 and PC2. Genes with the greatest contribution are highlighted in red. (C) Volcano plot highlighting DEGs (FDR <0.01; red = upregulated, blue = downregulated) at day 1 after vaccination compared with pre-vaccination expression (99 DEGs, n = 72). (D) Volcano plot highlighting DEGs (FDR <0.01; red = upregulated, blue = downregulated) at post-vaccination day 7 compared with pre-vaccination expression (140 DEGs, n = 67). (E) Volcano plot highlighting DEGs (FDR <0.01; red = upregulated, blue = downregulated) at 12 hours after challenge compared with pre-challenge expression (678 DEGs, n = 101). (F) Volcano plot highlighting DEGs (FDR <0.01; red = upregulated, blue = downregulated) at day 7 after challenge (in the non-diagnosed group) compared with pre-challenge expression (172 DEGs, n = 50). (G) Volcano plot highlighting DEGs (FDR <0.01; red = upregulated, blue = downregulated) at typhoid diagnosis compared with pre-challenge expression (6,854 DEGs, n = 47). P values were obtained from the moderated t statistic, after adjustment for multiple testing (Benjamini and Hochberg’s method). The top 10 genes, ranked by FDR, are labeled.

