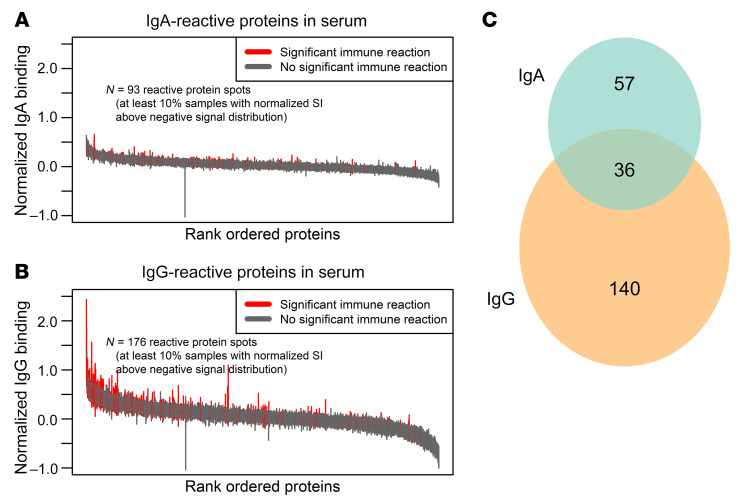
Figure 1. Humoral immunity to Cryptosporidium antigens was isotype specific.
Immune responses are shown for (A) IgA and (B) IgG antibodies. The Y-axis is signal intensity after normalization and the X-axis shows Cryptosporidium antigens ranked by median signal intensity. Bars represent the interquartile range of each antibody response and are shown as red if antibodies were present in ≥ 10% of infants (seroprevalent). (C) The Venn diagram shows seroprevalent Cryptosporidium antigens with IgA- (green) and IgG-specific (orange) and overlapping immune responses.

