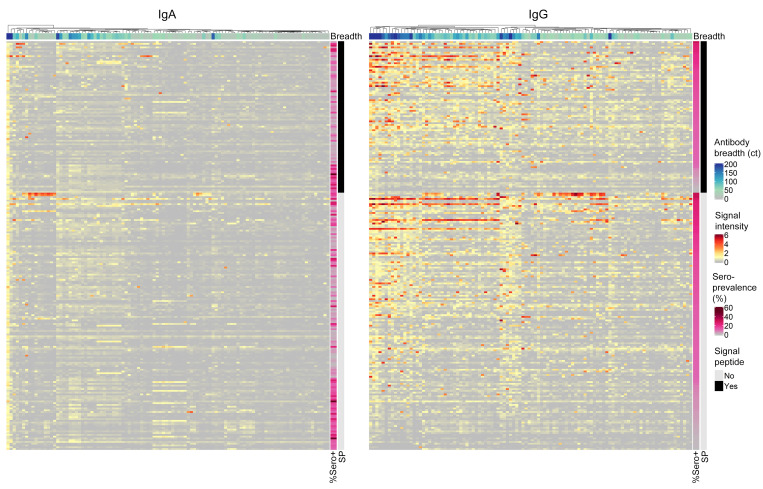
Figure 2. Cryptosporidium antigens recognized by IgA and IgG antibodies.
The proteomic microarray was used to measure the parasite-specific antibody response in the infants enrolled in our study cohort at 1 year in age. Previously infected children (columns) and the Cryptosporidium antigens (rows) that stimulated a strong IgG and/or IgA antibody response (present in > 10% of the children; n =232 antigens) are shown. The spot signals were normalized by first determining the specific background component by use of mixture models and setting this value to 0. Bar at the top of each heat map indicates the total number of Cryptosporidium antigens each child responds to (Antibody Breadth). The side bars indicate: (a) the seroprevalence of each antigen (% Sero+) and (b) presence of a membrane-targeting signal peptide (SP).

