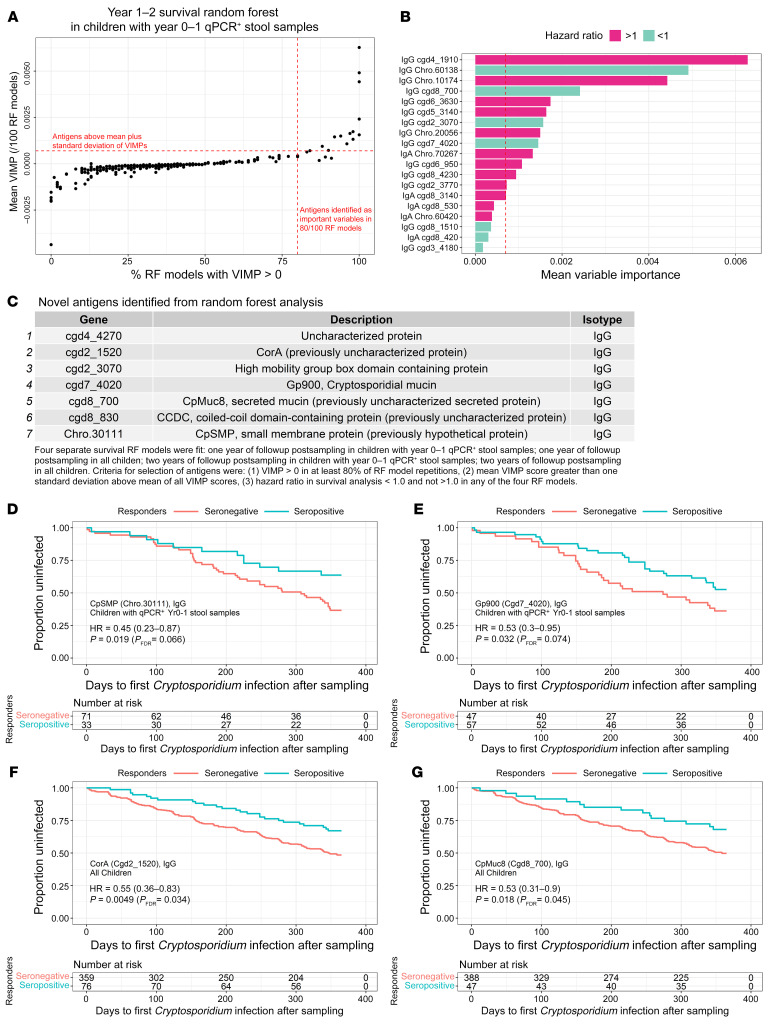
Figure 7. RF analysis for selection of important antigens and analysis of risk during the first year after sampling.
(A) The scatter plot represents antigens and clinical variables ranked by VIMP scores in RF using 1,000 trees constructed per model. Models were fit to survival data during one year of follow up after sampling on seropositive and seronegative children that all previously had qPCR-confirmed Cryptosporidium infections. Models using the entire cohort of children and 2-year follow-up periods are shown in Supplemental Figure 8. Each model was repeated 100 times, and the VIMP score was averaged across all runs (Y-axis). For each antigen, the percentage of runs where VIMP was greater than 0 (i.e., important to the model) was calculated (X-axis). The red horizontal dashed lines represent the mean of all VIMP scores plus 1 SD. The vertical dashed red lines represent antigens with at least 80% positive VIMP scores. The upper right quadrant shows the antigens selected as important variables in the model. (B) The horizontal bar plot represents VIMP scores for each antigen with at least 80% positive VIMP scores. The vertical red dashed line represents the cutoff for selection of important variables (equivalent to the horizontal lines in A). HRs calculated in the survival analysis were shown as protective (HR < 1, teal) or not (HR > 1, magenta). (C) Only protective antigens with at least 80% positive VIMP scores and VIMP scores above the importance cutoff were selected for individual antigen analysis. (D–G) The Kaplan Meier plots represent the 2 most significant previously unknown antigens associated with protection in children with prior qPCR+ stool samples or all children, respectively, after feature selection using RF.

