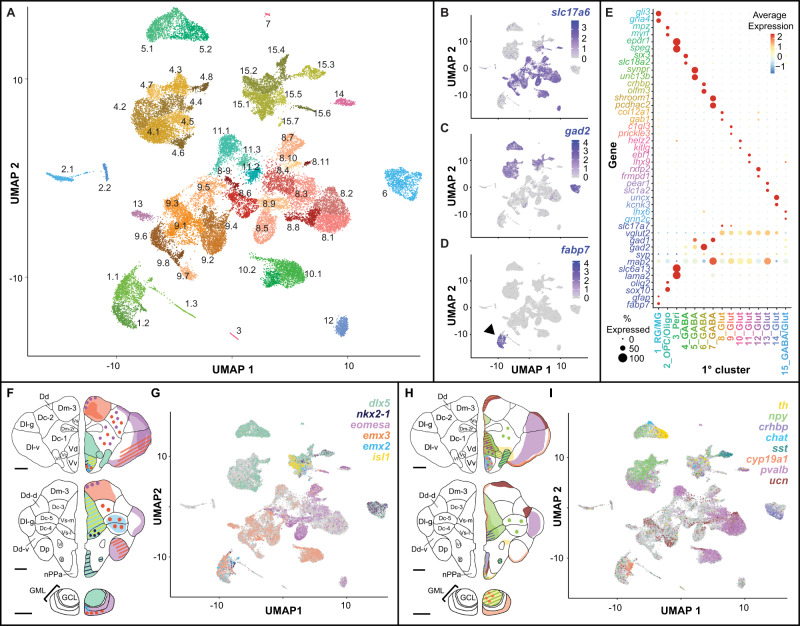
Fig. 2. Cellular diversity of the cichlid telencephalon.
A Nuclei cluster into 1° (n = 15) and 2° (n = 53) clusters. B–D Known marker genes reveal distinct clusters of B excitatory neurons (slc17a6+), C inhibitory neurons (gad2+), and D radial glia (fabp7+), as well as other less abundant cell types (see Supplementary Data File 2). E Clusters are distinguished by genes exhibiting nearly cluster-exclusive expression (top rows) as well as established cell type marker genes (bottom rows). F–I Genes encoding conserved F, G nTFs and H, I ligands (or ligand-related proteins) that exhibit conserved neuroanatomical expression profiles in teleost fishes (schematic representations of conserved expression patterns shown in panels F, H show distinct cluster-specific expression profiles). Anatomical figures adapted with permission from Dr. Karen Maruska. Data related to this figure can be found in Supplementary Data 2, 3.

