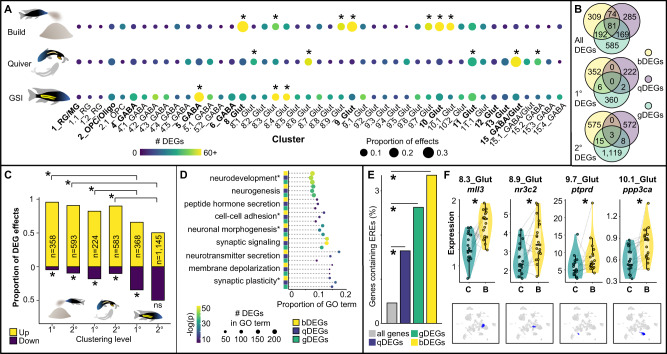
Fig. 4. Building, quivering, and GSI are associated with distinct patterns of cell type-specific gene expression.
A Build-DEGs (top row), quiver-DEGs (middle row), and gonad-DEGs (bottom row) were overrepresented in distinct sets of 1° and 2° clusters (FET, two-sided, asterisks indicate significance after adjustment for 5% false discovery rate). B Many of the same genes show building-, quivering-, and gonadal-associated expression (n = 81, top Venn diagram, overlap is considered regardless of the cluster in which the DEG effect was observed), but in distinct patterns across clusters (1° cluster DEGs, middle Venn diagram; 2° cluster DEGs, bottom Venn diagram; overlap considers the cluster in which the DEG effect was observed; low overlap among build-DEGs, yellow; quiver-DEGs, purple; gonad-DEGs, green). C Behavior-associated gene expression is driven by upregulation (first four bars; 1° build-DEGs, 342/358, X2(1, N = 358) = 184.96, p = 4.01 × 10−42; 2° build-DEGs, 537/593, X2(1, N = 593) = 231.54, p = 2.75 × 10−51; 1° quiver-DEGs, 184/224, X2(1, N = 224) = 50.19, p = 1.39 × 10⁻¹²; 2° quiver-DEGs, 524/583, X2(1, N = 583), p = 1.81 × 10−49; Pearson’s Chi-squared test with Yates’ continuity correction, two-sided), whereas gonadal-associated gene expression is driven by a balance of up- and downregulation (last two bars, 1° gonad-DEGs, 242/368, X2(1, N = 368) = 18.1, p = 2.09 × 10⁻⁵; 2° gonad-DEGs, 576/1,145, X2(1, N = 1145) = 0.011, p = 0.92; Pearson’s Chi-squared test with Yates’ continuity correction, two-sided). D Build-DEGs, quiver-DEGs, and gonad-DEGs are enriched for many of the same GO terms related to synaptic structure, function, and plasticity; neurotransmission; and neurogenesis (Hypergeometric test, one-sided, Bonferroni corrected; GO terms followed by asterisks are abbreviated). E build-DEGs, quiver-DEGs, and gonad-DEGs are enriched for estrogen response elements compared to other genes throughout the genome (left barplot; build-DEGs, yellow, odds ratio = 7.33, CI95 = [4.42,11.60], p = 7.26 × 10⁻¹²; quiver-DEGs, purple, odds ratio = 3.53, CI95 = [1.65,6.72], p = 9.23 × 10⁻⁴; gonad-DEGs, green, odds ratio = 5.63, CI95 = [3.57,8.57], p = 1.42 × 10⁻¹³; FET, two-sided). F Violin plots show example effects for build-DEGs containing estrogen response elements in four different clusters (gray lines link paired building/control males, blue labeling below violin plots highlights clusters in which each effect was observed); n = 38 biologically independent animals (n = 19 building males, n = 19 control males). In all box plots, the center line indicates the median, the bounds of the box indicate the upper and lower quartiles, and the whiskers indicate 1.5x interquartile range. Asterisks indicate significance after adjustment for a 5% false discovery rate. Source data are provided as a Source Data file, and additional related data can be found in Supplementary Data 7–9. Fish artwork in panels A and C is reprinted from iScience, Vol 23 / Issue 10, Lijiang Long, Zachary V. Johnson, Junyu Li, Tucker J. Lancaster, Vineeth Aljapur, Jeffrey T. Streelman, Patrick T. McGrath, Automatic Classification of Cichlid Behaviors Using 3D Convolutional Residual Networks, 2020, with permission from Elsevier.

