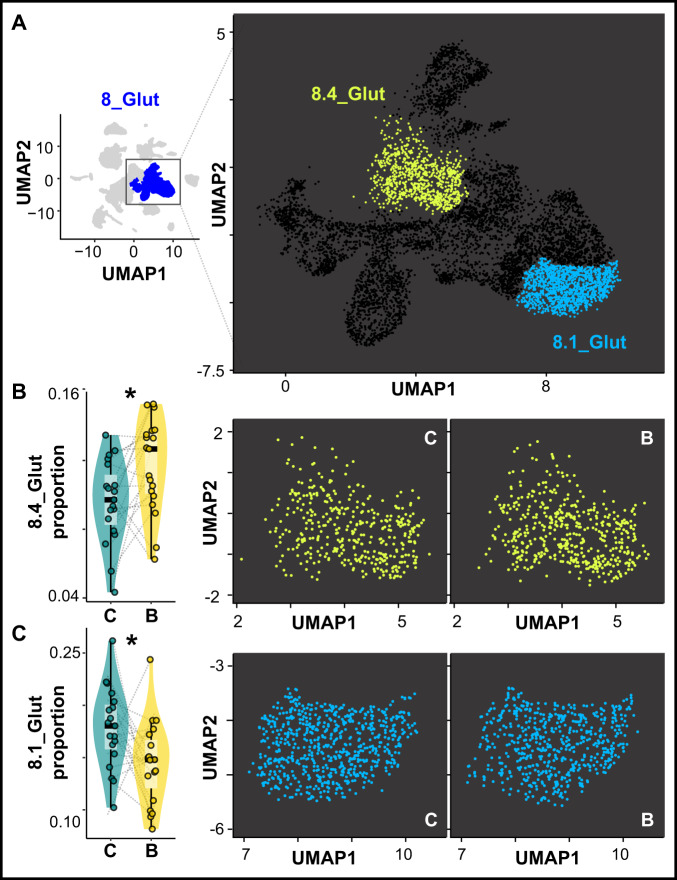
Fig. 5. Building-associated changes in the relative proportions of excitatory neuronal subpopulations.
A Two neuronal populations within 8_Glut exhibit building-associated changes in proportions. B 8.4_Glut exhibits a building-associated increase in its relative proportion within 8_Glut (two right panels show 8.4_Glut nuclei in control, “C,” versus building “B,” males, pooled across individuals; linear mixed-effects regression assuming a binomial distribution, two-sided, adjusted for 5% false discovery rate, q = 0.013), n = 38 biologically independent animals (n = 19 building males, n = 19 control males). C 8.1_Glut exhibits a building-associated decrease in its relative proportion within 8_Glut (two right panels show 8.1_Glut nuclei in control versus building males, pooled across individuals; linear mixed-effects regression assuming a binomial distribution, two-sided, adjusted for 5% false discovery rate, q = 7.67 × 10⁻⁴), n = 38 biologically independent animals (n = 19 building males, n = 19 control males). Gray lines link paired building/control males. In all box plots, the center line indicates the median, the bounds of the box indicate the upper and lower quartiles, and the whiskers indicate 1.5x interquartile range. Asterisks indicate significance at α = 0.05 after adjusting for a 5% false discovery rate. Source data are provided as a Source Data file, and additional related data can be found in Supplementary Data 3.

