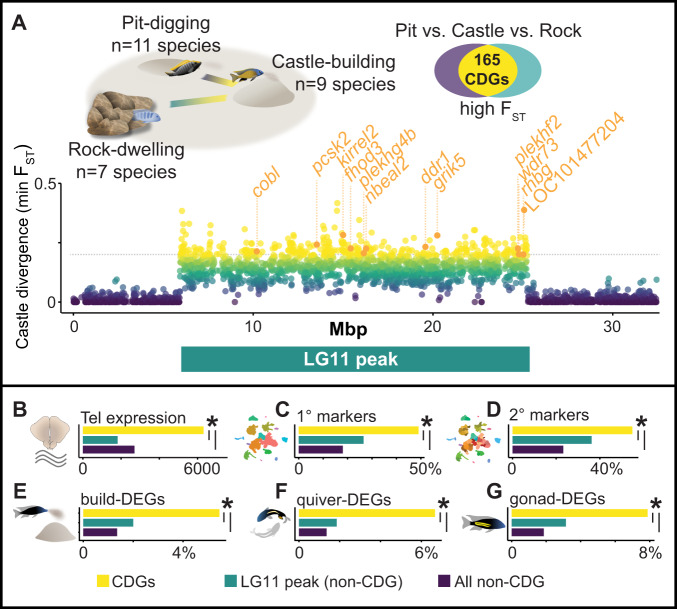
Fig. 7. Castle-divergent genes show distinct and building-associated expression patterns in the telencephalon.
A Genome comparisons of 27 species that build castles (n = 9), dig pits (n = 11), or do not construct bowers (n = 7) reveal 165 CDGs (CDG module genes labeled in orange). B CDGs (yellow) are expressed at higher levels in the telencephalon compared to other genes within the 19 Mbp region on LG11 (turquoise, pperm = 1.42 × 10⁻⁵, two-sample permutation test, two-sided) and compared to other genes throughout the genome (purple, pperm = 1.77 × 10⁻⁶, two-sample permutation test, two-sided; x-axis represents summed normalized expression values across all nuclei, averaged for each category). C CDGs are overrepresented among 1° cluster markers compared to other genes within the 19 Mbp region on LG11 (odds ratio = 3.61, CI95 = [2.42,5.38], p = 8.31 × 10⁻¹¹, FET, two-sided) and compared to other genes throughout the genome (odds ratio = 3.12, CI95 = [2.25,4.31], p = 1.43 × 10⁻¹¹, FET, two-sided). D CDGs are overrepresented among 2° cluster markers compared to other genes within the 19 Mbp region on LG11 (odds ratio = 3.08, CI95 = [2.12,4.50], p = 1.66 × 10⁻⁹, FET, two-sided) and compared to other genes throughout the genome (odds ratio = 3.13, CI95 = [2.27,4.30], p = 1.51 × 10⁻¹², FET, two-sided). E CDGs are overrepresented among build-DEGs compared to other genes within the 19 Mbp region on LG11 (odds ratio = 4.19, CI95 = [1.41,12.72], p = 0.0044, FET, two-sided) and compared to other genes throughout the genome (odds ratio = 2.82, CI95 = [1.26,5.53], p = 0.0066, FET, two-sided). F CDGs are overrepresented among quiver-DEGs compared to other genes within the 19 Mbp region on LG11 (odds ratio = 5.19, CI95 = [1.86,15.14], p = 5.79 × 10⁻⁴, FET, two-sided) and compared to other genes throughout the genome (odds ratio = 3.79, CI95 = [1.84,7.02], p = 3.01 × 10⁻⁴, FET, two-sided). G CDGs are overrepresented among gonad-DEGs compared to other genes within the 19 Mbp region on LG11 (odds ratio = 4.50, CI95 = [1.82,11.33], p = 4.23 × 10⁻⁴, FET, two-sided) and compared to other genes throughout the genome (odds ratio = 2.63, CI95 = [1.37,4.67], p = 0.0024, FET, two-sided). Source data are provided as a Source Data file, and additional related data can be found in Supplementary Data 14, 15. Fish artwork in panels A, E, G is reprinted from iScience, Vol 23 / Issue 10, Lijiang Long, Zachary V. Johnson, Junyu Li, Tucker J. Lancaster, Vineeth Aljapur, Jeffrey T. Streelman, Patrick T. McGrath, Automatic Classification of Cichlid Behaviors Using 3D Convolutional Residual Networks, 2020, with permission from Elsevier. Drawings of pit-digging and rock-dwelling cichlids were adapted from original artwork published previously15,74.

