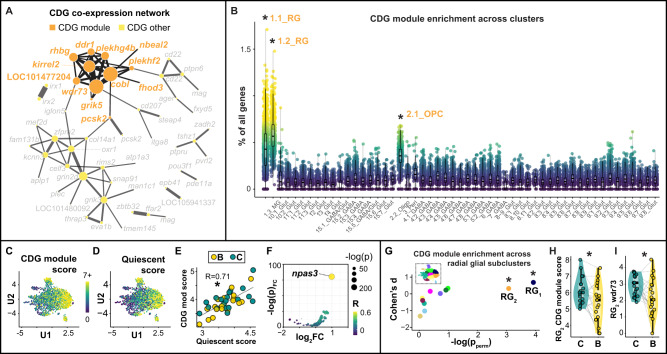
Fig. 8. A CDG module shows enriched and building-associated expression patterns in a subpopulation of radial glia.
A A weighted gene correlation network analysis identifies a module of 12 CDGs (orange dots connected by black lines) that are strongly co-expressed across telencephalic nuclei compared to other CDGs (yellow dots connected by dark gray lines). B The CDG module is most strongly enriched in radial glia (two leftmost columns), n = 53 biologically independent 2° clusters. Asterisks indicate effects that were significant after adjustment for a 5% false discovery rate and additionally as measured by a second permutation test. C, D CDG module expression across radial glia mirrors expression of quiescent markers. E Expression of the CDG module is positively correlated with the expression of radial glial quiescence markers. F npas3 shows strong, positive, outlier co-expression with the CDG module (Pearson’s R = 0.47, CI95 = [0.43,0.50], q = 3.19 × 10−100). G Among radial glial subclusters, the CDG module is enriched in RG1 and RG2; n = 11 biologically independent radial glia subclusters. H, I RG2 exhibits building-associated decreases in expression of H the CDG module and I wdr73 in particular; n = 38 biologically independent animals (n = 19 building males, n = 19 control males). Gray lines link paired building/control males. In all box plots, the center line indicates the median, the bounds of the box indicate the upper and lower quartiles, and the whiskers indicate 1.5x interquartile range. Asterisks indicate effects that were significant after adjustment for a 5% false discovery rate. Source data are provided as a Source Data file, and additional related data can be found in Supplementary Data 15–18.

